Hurricane Otis (Continued) | November 2023
November 27, 2023 | Acapulco, Guerrero State, Mexico
Report I: Damage Assessment vs. Population Densities
This situation report on Hurricane Otis in Acapulco, Mexico shows the relationship between damage assessment data with changes in population densities. The combined data reveals insights on the long-term impacts of the hurricane in the areas of greatest impact.
The damage assessment data was produced by Google SKAI. The population data was produced by WorldPop.
November 27, 2023 | Acapulco, Guerrero State, Mexico
Report II: Damage Assessment vs. Healthcare Facilities
This situation report shows the relationship between damage assessment data with healthcare facility data in Acapulco. The data shows that 29 out of 77 total healthcare facilities (38%) are marked as having ‘Major Damage,’ while some are marked as being ‘Destroyed.’
Earthquake in Nepal | November 2023
November 4, 2023 | Northwestern Nepal
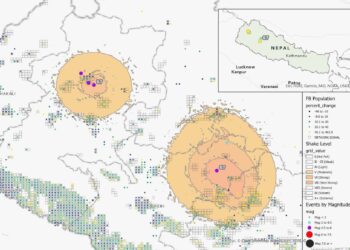
This report provides information changes in population densities in Nepal a day after the earthquakes struck the country. The data provides insights on potential patterns of population displacement in the aftermath of the disaster.
The percentage changes are based on a comparison between the current mobility data obtained from Meta’s Data for Good program and the baseline population figures that were recorded 90 days before the earthquakes struck Nepal
Key Observations:
Increases in Population Densities
- There was a substantial rise in the number of people per area in regions that experienced “strong” to “very strong” shaking. In these areas, the population density increased by as much as 40% over the usual number of people living there before the earthquakes.
Decreases in Population Densities
- Areas closest to the earthquake’s origin, specifically within the Seti Zone shake region, there was a notable decrease in population density, with reductions of more than 10% compared to the usual population numbers before the earthquake.
Network Coverage
- The regions impacted by the earthquakes have a relatively limited network coverage. This might influence the accuracy of the data on changes in population density since not all areas may be equally monitored or reported.
Hurricane Otis | October 2023
October 26, 2023 | Southwestern Mexico (Pacific Coast)
This report, provided in Spanish and English, includes information on the disaster perimeter of Hurricane Otis in Mexico, as well as baseline community vulnerabilities and population movement (as measured by changes in population densities) a day before the storm made landfall in southwestern Mexico.
Key Observations
Signal loss was most severe in Acapulco de Juarez, Copala, and San Marcos, with losses of 97%, 97%, and 92% respectively. Eleven administrative units, including Ometepec and Coyuca de Benitez, experienced drastic population density shifts between October 24th and 26th. Notably, Tecpan de Galeana and Petatlan saw significant population increases of 10% and 9%. Chilpancingo de los Bravo, with a 6% rise, gained 3,325 Facebook users in just one day, indicating it’s a hub for the displaced population.
October 25, 2023 | Southwestern Mexico (Pacific Coast)
This report, provided in Spanish and English, includes information on the disaster perimeter of Hurricane Otis in Mexico, as well as baseline community vulnerabilities and population movement (as measured by changes in population densities) a day before the storm made landfall in southwestern Mexico.
Key Observations
Hurricane Otis inflicted severe infrastructure damage, causing near-total signal loss around its trajectory. Coastal communities near Acapulco, such as Acapulco de Juárez (-99%) and Ayutla de los Libres (-98%), witnessed major population decreases, likely due to network outages rather than actual movements. Conversely, few areas, like Coyuca de Catalan (+6%) and Chilpancingo de los Bravo (+3%), saw population growth.
October 24, 2023 | Southwestern Mexico (Pacific Coast)
REPORT IN SPANISH
This report provides information on the disaster perimeter of Hurricane Otis in Mexico, as well as baseline community vulnerabilities and population movement (as measured by changes in population densities).
Key Observations
Decreases in Population Densities
- Little evidence of significant population movement away from coastal areas just before Hurricane Otis made landfall.
- Exceptions include communities to the southeast of Acapulco, including Copala, Florencio Villarreal, Marquelia, Juchitán, and Cuautepec, which experienced a population declines between -5% and -15% compared to a 90-day pre-disaster baseline.
- The southeastern side of Acapulco recorded population reductions greater than -10% in several locations.
- Other areas of Acapulco, apart from the southeastern side, remained largely unchanged in terms of population density.
Population & Community Information
- Acapulco’s population is generally younger compared to surrounding areas.
- 9% of Acapulco’s population is over 60, compared to 11%-12% in Cautepec and Copala.
Flooding in Libya | September 2023
September 26, 2023 | Derna, Libya
This report provides an assessment of minor and major damages in Derna, Libya. The visualization compares data from Google’s machine learning model for post-disaster damage assessment and satellite imagery.
More information on Google’s data assessment model can be found here.
Key Observations:
- The probability of minor damage to infrastructure affects a much larger area of Derna than the possibility of major damage.
- Buildings within 0.3 km2 hex tile areas has a 39% chance of suffering minor damage and a 9% chance of suffering major damage.
- Major damage was disproportionately concentrated within the immediate flood areas.
- Minor damage was distributed throughout Derna.
September 25, 2023 | Northern Libya
This report provides an overview of Google’s machine learning-derived damage assessment data in Libya, particularly in the regions most affected by recent floods.
More information on Google’s data assessment model can be found here.
Key Observations:
- Damage assessment data from Google, focusing on the probability that buildings have been destroyed or suffered major damage, indicates potential serious impacts on healthcare facilities in Derna.
- Two clinics in the central area of Derna likely faced significant damage.
- Two pharmacies and the public hospital are in zones with a low probability of major damage.
- Healthcare facility data was sourced from healthsites.io.
September 19, 2023 | Northern Libya
This report provides information on population displacement dynamics, network outages, and healthcare infrastructure in the regions of Libya most affected by floods, especially Derna.
More information
The report finds that between the 17th and 19th of September, Darnah experienced a significant drop in Facebook users, primarily in the hard-hit city of Derna, due to a major network outage, while other regions in eastern Libya remained unaffected.
September 17, 2023 | Northern Libya
This report provides insights into population displacement dynamics and healthcare infrastructure in the regions of Libya most affected by recent floods. Changes in population density were analyzed using Facebook mobility data collected on September 17 against a 90-day pre-crisis baseline.
As of September 17th, population densities in flood-affected regions, monitored via Facebook users, have generally increased, particularly around Bayda and Al Abraq International Airport. However, coastal areas between Derna and El Akhrab have seen a decline, likely due to uninhabitable conditions and relief efforts.
September 15, 2023 | Northern Libya
This report provides insights into the population displacement dynamics and healthcare infrastructure in the regions of Libya most affected by recent floods. The report pays special attention to changes in population densities registered on Thursday, September 13.
Data indicates a 10% population rise in Darnah as of September 14th, likely due to rescue efforts, while coastal areas report a 75% decline. The health infrastructure in Derna is severely affected, with almost all facilities inundated except one.
September 13, 2023 | Northern Libya
This report provides insights into the population dynamics and healthcare infrastructure in the aftermath of the devastating flooding in Libya, especially in the coastal city of Derna.
The report finds there was a 40% population decline in Derna, one of the hardest-hit areas of the country. The region’s healthcare infrastructure appears limited, with discrepancies between open-source data and potential official records.
Earthquake in Morocco | September 2023
September 12, 2023 | Western Morocco
This report provides information on population density changes in the regions affected by the earthquake in Morocco. It also provides general information on the status of network connectivity in the area.
September 12, 2023 | Western Morocco
This report provides network coverage maps in the regions affected by the earthquake in Morocco. The map indicates where Facebook users accessed 2G, 3G, or 4G connections on their mobile devices on Saturday, September 9, a day after the earthquake struck.
The coverage is determined from the type of cell sites users connect to when updating their Facebook app, not from telecommunication services. It reflects the estimated coverage and connection type based on user device reports.
The report reveals that out of 2,527,304 people living in the severe shake zones, only about 531,070 have internet access. This suggests roughly 79% of individuals in these areas don’t have online connectivity.
September 10, 2023 | Western Morocco
This report, using data from Meta’s Data for Good initiative, shows population densities in the areas of Morocco that were hardest hit by the recent earthquake. Population density is juxtaposed with the quake’s severity scale, which spans from 6 to 8.
The findings show that the regions with the highest population densities experienced a severity level of 6 during the quake on the evening of September 8. Conversely, the areas with severity level 8 had the fewest inhabitants.
September 9, 2023 | Western Morocco
To provide deeper insights into the socio-economic impacts of the earthquakes in Morocco, this report employs Meta’s Relative Wealth Index (RWI). This tool showcases the distribution of wealth across the areas of the country most affected by the recent tremors.
Meta’s Relative Wealth Index (RWI) can be accessed here: https://dataforgood.facebook.com/dfg/tools/relative-wealth-index
Hurricane Idalia | August – September 2023
September 3, 2023 | Northwest Florida, United States 7:00 PM local time
This report provides data on population density changes in Florida as of Sunday, September 3, 2023 at 7:00 p.m. local time.
The report also provides information on baseline population vulnerabilities and local healthcare infrastructure.
August 31, 2023 | Northwest Florida, United States 7:00 PM local time
This report provides data on population density changes in Florida as of Thursday, August 31, 2023 at 7:00 p.m. local time.
The report also provides information on baseline population vulnerabilities and local healthcare infrastructure.
August 30, 2023 | Northwest Florida, United States 7:00 PM local time
This report provides data on population density changes in Florida as of Wednesday, August 30, 2023 at 7:00 p.m. local time.
The report also provides information on baseline population vulnerabilities and local healthcare infrastructure.
August 29, 2023 | Northwest Florida, United States 7:00 PM local time
This report provides data on population density changes in northern and central Florida as of 7:00 p.m. local time on Tuesday, August 29, 2023, the evening prior to Hurricane Idalia’s landfall. It highlights population displacement during the period evacuation orders were issued by state and county officials.
Additionally, the report provides information on baseline population vulnerabilities and the status of local healthcare infrastructure.
Tropical Storm Hilary | August 2023
August 20, 2023 | Southern California, 7:00 PM local time
This report provides information on local healthcare infrastructure as well as baseline population vulnerabilities and density changes in Southern California registered on Sunday, August 20 at 19:00 EDT (7:00 p.m. local time).
Wildfires in Hawaii | August 2023
August 15, 2023 | Maui, Hawaii, 7:00 PM Local Time
This report provides information on population density changes registered on Tuesday, August 15 at 18:00 CDT (7:00 p.m. local time) in the regions of Hawaii most affected by the wildfires.*
The report also provides information on baseline community vulnerabilities and local health care infrastructure.
Key Observations
Death Toll & General Updates:
- The wildfires in Maui, Hawaii have caused 106 deaths.
- Rescue and identification efforts are ongoing.
- Upcountry/Kula fire is about 75% contained.
- Lahaina fire is 85% contained.
Decreases in Population Densities:
- Data shows ongoing decreases in population densities in Western Maui.
- Lahaina remains 91% decreased from baseline, but this may change as Lahaina bypass road opened on 16 Aug.
- Napili-Honokowai and Kapalua in the NW show slow returns to baseline, but remain around 50% decreased from baseline.
- Wailea, Makena, Hana, and the area of Hamoa beach on the southern and east areas of the island, not directly affected by the fires, show decreased population densities from baseline.
- The decrease in population densities in Wailea, Makena, Hana, and Hamoa beach areas may be due to the decrease in tourism, as they are reported open for tourism through newswires, but media reports show an overall decrease in inbound flights over the past week
Increases in Population Densities:
- Areas east of the Lahaina fire have population densities above baseline from 16% – 32%, but are trending toward baseline
- Maalalaea and Waikapu, between the Lahaina and Upcountry Maui/Kula fires, continue to trend toward baseline population levels.
- Current increases in population densities for Maalalaea and Waikapu are now 20% and 29% respectively
- Areas east of the Upcountry Maui and Kula fires continue to have population densities above baseline, but continue to trend toward baseline (ranging from 16% – 25%)
Other Observations:
- Honolulu Island has seen population density increases above baseline since August 9th.
- It is unclear from the analysis what may be causing these changes in Honolulu Island and if they are directly related to the Maui wildfires.
*Please note: The data reflects 8% to 21% of the population in the affected areas who have active location services, so it provides a snapshot rather than a complete picture of the mobility patterns.
August 14, 2023 | Hawaii, 7:00 PM Local Time
This report provides information on population density changes registered on Monday, August 14 at 18:00 CDT (7:00 p.m. local time) in the regions of Hawaii most affected by the wildfires.*
The report also provides information on baseline community vulnerabilities and local health care infrastructure.
Key Observations
Death Toll & General Updates:
- 99 confirmed deaths as of Tuesday, August 15.
- Rescue and identification efforts are ongoing.
- Upcountry/Kula fire is about 65% contained.
- The Lahaina fire is 85% contained.
Decreases in Population Densities:
- As of August 14, mobility data from Data for Good continues to show significant decreases in population densities in various regions of Maui.
- In Western island areas including Kapalua, Mahinahina, and Napili-Honokowai:
- Population density remains decreased compared to pre-fires levels.
- Slowly returning to baseline levels.
- Return of people to those locations or the arrival of new populations, such as first responders, may be occurring but are not yet confirmed.
- In Launiupoko, Kaanapali, and Lahaina:
- Population densities have decreased between 50% – 92% compared to pre-crisis levels.
- This remains consistent with previous observations.
Increases in Population Densities:
- Ongoing increases in population densities near the most affected areas, but some areas are trending slowly toward baseline.
- Maalalaea and Waikapu, between the Lahaina and Upcountry Maui/ Kula fires:
- Currently have population densities that are 30% – 40% above baseline levels.
- These are trending to normal, pre-fire levels.
- Areas east of the Upcountry Maui and Kula, including Pukalani, Haliimaile, and Kula:
- Continue to have population densities above baseline levels.
- Currently, these areas are moving toward normal population levels with densities less than 20% relative to baseline.
*Please note: The data reflects 8% to 21% of the population in the affected areas who have active location services, so it provides a snapshot rather than a complete picture of the mobility patterns.
August 12, 2023 | Hawaii, 7:00 PM Local Time
This report provides information on population density changes registered on Saturday, August 12 at 18:00 CDT (7:00 p.m. local time) in the regions of Hawaii most affected by the wildfires.*
The report also provides information on baseline community vulnerabilities and local health care infrastructure.
Key Observations
Death Toll & Causes:
- 96 confirmed deaths and over 1,000 people reported missing.
- Causes include drought, high winds, and downed power lines.
Decreases in Population Densities:
- Significant decreases in population densities in western areas such as Napili-Honokowai, Kapalua, Mahinahina, Launiupoko, Kaanapali, and Lahaina.
- Decreases range from 56% to 95% compared to pre-crisis levels.
- 15% to 38% of the population in these areas are older than 65 years.
Increases in Population Densities:
- More than 34% increase in areas such as Waikapu, Wailuku, Maalaea, Waihee-Waiehu, and Kahului.
- Smaller increases of less than 34% near the Upcountry and Kihei fire perimeters in the island’s center.
- Shelters have been opened in various locations, including Kahului, Kihei, Makawao, Pukalani, and Mailuku, as reported by local news sources.
*Please note: The data reflects 8% to 21% of the population in the affected areas who have active location services, so it provides a snapshot rather than a complete picture of the mobility patterns.
August 10, 2023 | Hawaii, 7:00 PM Local Time
This report provides information on population density changes registered on Thursday, August 10 at 18:00 CDT (7:00 p.m. local time) in Maui, Hawaii.
The report also provides information on baseline community vulnerabilities and local health care infrastructure.
Key Observations
- 55 people have been killed as of August 11, 2023.
- Population densities along the western shores of Maui have decreased by 84% to 99%.
- The greatest population decreases occurred in Lahaina, Kaanapali, Kapalua, and Mahinahina.
- There have been increasing population densities in Kahului, where most shelters have been opened, as well as in Wailuku and Waihee-Waiehu to the north of Kahului.
Cyclone Biparjoy, Gujarat, India | June 2023
June 18, 2023 | Gujarat, India
This report provides information on population density changes in Gujarat, India, as of Sunday, June 18 at 4:30 a.m. local time.
The report also provides information on preexisting population vulnerabilities and healthcare facilities in the affected regions.
Key Observations:
- The following areas experienced population declines ranging between -14% to -77% below baseline on the morning of June 18, 2023:
- Banas Kantha
- Rajsamand
- Diu
- Barmer
- Devbhumi Dwarka
- Sirohi
- Kachchh
- Jalor
- The greatest decrease in population occurred in Kachchh, which saw a decline of more than 36,000 people (-52%) at the time of analysis.
- The majority of movement from Kachchh was directed towards Ahmedabad.
- The following areas experienced population increases — some as high as +6% above baseline — on the morning of June 18, 2023:
- Vadodara
- Anand
- Rajkot
- Bharuch
- Based on the mobility matrix, the most significant increased rate of transit was between Ahmedabad and Gandhinagar, where outflows were increased by +4% and inflows by +7%.
2023 Emilia-Romagna floods | May 2023
May 31, 2023 | Northwest Italy
This report provides information on population movement in northwestern Italy, especially in the Emilia-Romagna region, where floods swept the region from May 17 to May 21, 2023.
Key Observations:
- In the flooded areas, there was a sharp decline in population density of roughly -10% on the days of peak flooding.
- At the time of analysis, increasing population densities were seen along the coast, to the north and south of Ravenna.
Cyclone Mocha, Myanmar & Bangladesh | May 2023
May 17, 2023 | Southern Bangladesh
This report provides information on population movement, baseline population vulnerabilities, and healthcare infrastructure in Bangladesh as of Wednesday, May 17, 2023, three days after Cyclone Mocha made landfall in the country.
Key Observations:
- As of the morning of May 17, population densities in the most affected area of Cox’s Bazar have returned to baseline values.
- Within Cox’s Bazar, the exception to this rule is near the Rohingya camps, which continues to see rates of decrease between -10% and -50%.
- The most significant decreases in population were seen to the North of Cox’s Bazar, in Bhola, Lakshmipur, and Chandpur.
- These three districts all show decreases in population density ranging between -5% and -29%, with the greatest decreases happening on the night of May 16.
- The city of Chittagong, however, saw modest increases in its population density (+1%), and a significant rate of mobility within the city itself (+22%).
May 16, 2023 | Southern Bangladesh
This report provides information on population movement, baseline population vulnerabilities, and healthcare infrastructure in Bangladesh, following Cyclone Mocha’s landfall in the region on Sunday, May 14, 2023.
Key Observations:
- Cox’s Bazar, where the largest settlement of refugees in the world is located, showed a rapid decrease in population densities, ranging between -10% to -30%.
- Surrounding areas, including Bhola, Chittagong (Chattogram), and Lakshmipur showed modest rates of increasing population densities, around +10%.
- Network infrastructure remained mostly operational throughout this time period, which lends evidence to these relative increases being principally related to population movement.
- The storm caused lower impacts than expected, which aligns with the rapid speed of return to baseline population densities in most areas by May 16.
- Relatively higher rates of decrease could be seen throughout the more rural interior areas, away from urban centers on the coast.
May 16, 2023 | Myanmar; Nation Wide
This report provides information on the economic status of the regions in Myanmar most affected by Cyclone Mocha, which made landfall in the country of Sunday, May 14.
The report was generated using the Relative Wealth Index from Data for Good at Meta. The Index uses household surveys, non-traditional data sources, deep learning and supervised machine learning to assign a relative score for household wealth at the 2.4km2 level.
Key Observation:
- Although the extent of the storm’s damage is still relatively unknown, the Relative Wealth Index from Data for Good at Meta suggests that the most impacted areas were also the poorest, overall.
Armed Conflict in Sudan | May 2023
May 10, 2023 | Sudan; Africa and Middle East
This report uses the Social Connectedness Index from Meta to show the scale of social connections between individuals in Sudan and individuals throughout Africa and the Middle East. These connections are often predictive of the long-term displacement dynamics of refugees.
Key Observations:
- The top five countries with the highest number of social connections with individuals in Sudan include Ethiopia, Libya, Chad, Niger, and Saudi Arabia.
- The “Scaled Social Connectedness Index” to the right of the map lists the states in Sudan in order of the number of social connections.
- The Sudanese states with the highest number of social connections are West Kurdufan, Blue Nile, South Darfur, West Darfur, Northern Sudan, and North Kurdufan.
Earthquakes in Turkey | February – March 2023
March 15, 2023 | Southern Turkey
This report provides information on population density changes registered as of Wednesday, March 15 at 11:00 a.m. local time in southern Turkey, near the border of Syria.
Key Observations:
- Displacement dynamics across southern Turkey have largely stabilized over the past week, with only minor rates of population density change being registered.
- The two cities seeing the greatest reductions are Malatya (-58%) and Antakya/Hatay (-60%).
- Kahramanmaraş, İslahiye, İskenderun, and Kırıkhan are gradually returning to baseline population values, but still remain well-below pre-crisis numbers.
- Reductions in these areas range from -17% to -37%.
- Cities seeing the greatest rates of increase are the following:
- Altınözü: +51%
- Kumlu: +38%
- Kilis: +27%
- Nizip: +26%
- Kadirli: +23%
- Şahinbey: +18%
March 5, 2023 | Southern Turkey
This report provides information on population density changes registered on Sunday, March 5 at 8:00 a.m. local time in southern Turkey, near the border of Syria.
Key Observations:
- The four most-affected provinces in Turkey — Hatay, Adıyaman, Kahramanmaraş, and Malatya — remain below baseline population densities by a variance of -7% to -44%.
- Significantly greater rates of population decrease were recorded in the main cities within each areas.
- Hatay, as a province, records a lower rate of population decrease than the city of Antakya (-51%) due to the high rate of displacement to the east and west of the city.
- All other provinces bordering the principal epicenter of the earthquake continue to show substantial population increases between +15% and +45%, with the highest proximate city-level rates occurring in:
- Altınözü: +81%
- Kumlu: +63%
- Erzin: +55%
- Reyhanlı: +48%
- Mersin: +33%
- The town of Samandağ, which in addition to the initial 7.8 magnitude earthquake was struck by a 6.3 magnitude aftershock on February 20, has nearly returned to its baseline population density.
March 3, 2023 | Turkey; Nation-Wide (Feb 5, 2023 – Mar 3, 2023)
This report provides an overview of post-earthquake changes in business activity across Turkey.
The report was generated by conducting a space-time hotspot analysis of the Facebook Business Activity Index between Sunday, February 5 — a day before the initial earthquake struck — and Friday, March 3.
The Index measures the normalized change in the rate of posting to Facebook business accounts, as a proxy measure of the rate of business activity divided into 11 business verticals. This report shows significantly high and low clusters of business activity as well as the pattern of clustering on a daily basis.
Key Observations:
- Business activity declined significantly within the earthquake zone while increasing in most other parts of the country.
- By March 3, business activity in the earthquake-affected areas remained well below the rest of the country, while a cluster of sporadically increasing activity was seen in the northeast.
March 1, 2023 | Southern Turkey
This report provides information on population density changes on Wednesday, March 1, at 8:00 a.m. local time in southern Turkey, near the border of Syria.
Key Observations:
- The four most-affected provinces of Adıyaman, Hatay, Kahramanmaraş, and Malatya remain significantly below baseline population, ranging from -16% to -42%.
- These decreases have remained stable for several days now, with cities in the most-affected areas registering slow (to zero) rates of change.
- Every province outside of the most-affected areas is registering significant rates of increase – from 14% in Nevsehir to 34% in Kilis.
- Three large cities — Şehitkamil, Yüreğir, and Mersin — registered population increases ranging from +18% to +26%.
- Similarly, the cities of Sanhufra, Seyhan, and Şahinbey saw increases in population densities between +15% and +22%.
February 26, 2023 | Turkey
This report provides information on population density changes on Sunday, February 26, at 00:00 GMT+3 in southern Turkey, near the border of Syria.
Key Observations:
- Although the population densities of Hatay, Adıyaman, Kahramanmaraş, and Malatya remain well below baseline — ranging from -12% to -41% — virtually all other provinces are showing substantial increases in densities.
- Mersin, Kayseri, Diyarbakır, Gaziantep, and others show increases up by +19% to +34% as of the morning of February 26.
- Nevşehir, Elâzığ, Yüreğir to Erzin and Kumlu show increases in population densities ranging from +18% to +65%.
- The Facebook population sample varies between 2% and 11% at the city level.
February 5 – February 26, 2023 | Turkey
This report provides a comparison of population density changes between Sunday, February 5 – Sunday, February 26, at 08:00 a.m. local time in Turkey.
Key Observations:
- Key cities outside the earthquake-affected areas — including Ankara, Kayseri, Nevşehir, Niğde, and Konya — show consistent increases in population densities since Sunday, February 5.
- Ankara: consistent +20% increase (since Feb 12)
- Kayseri: +20% – +35% increase (since Feb 5)
- Nevşehir: +15% – +25% increase (since Feb 5)
- Niğde: +20% – +45% increase (since Feb 5)
- Konya: +10% – +20% increase (since Feb 5)
- Percent changes, although not intended to indicate specific numbers of displaced person in each location, indicate the direction and magnitude of change in areas known to be receiving a high volume of displaced persons.
February 26, 2023 | Western Turkey
This report provides information on population density changes recorded on Sunday, February 26, at 08:00 GMT+3 in western Turkey.
Key Observations:
- Current data indicates that there is an estimated 2.2 million people displaced in Turkey, following the earthquakes and aftershocks that struck the country earlier this month.
- 1.9 million people in Turkey are being housed in tents or temporary shelters, and nearly 530,000 have been relocated outside the affected areas.
- As of the morning of February 26, virtually all of western Turkey — outside the areas most affected by the earthquakes — showed increasing population densities.
- The greatest increases in population densities were in Mersin (+26%), Niğde (+19%), and Adana (+15%).
- Although the province of Istanbul only showed an increase of +4% at the time of analysis, the capital city shows the highest overall gains in population due to the already high population.
- Population may be unevenly distributed throughout the metropolitan area.
February 20, 2023 | Turkey
This single-page report provides information on population density changes recorded on Monday, February 20, at 8:00 a.m. local time in the regions most impacted by the earthquakes in Turkey.
Key Observations:
- As of the morning of Monday, February 20, populations throughout the areas most affected by the earthquake on Feb 6 have shifted dramatically in key locations. This report focuses on five areas of significant change, both positive and negative: Adana, Karamanmaras, Gaziantep, Kilis, and Antakya.
- In the Adana area, there has been a steady incline of population densities down the coast of Mersin.
- Increases in population densities have stabilized between +40% and +60%.
- The city of Kahramanmaras has shown steady declines in population density, ranging between -30% to -60%, with gradual recent inclines.
- In the city of Gaziantep, population densities have increased nearly +20% since the last report on Friday, February 17.
- The Kilis and Elbeyli areas also registered around a +20% incline in population densities over baseline values.
- The city of Antakya remained well below baseline at the time of analysis — however, the area east of Antakya, close to the Syrian border, is now showing consistent inclines between +40% and +60%.
This report provides information on population density changes recorded on Monday, February 20, at 8:00 a.m. local time in the regions most impacted by the earthquakes in Turkey.
Key Observations:
- As of Monday, February 20, several areas that had previously shown stark declines in population densities after the earthquake were showing increasing trends, returning towards baseline population values.
- The government of Turkey currently estimates that 384,500 housing units have been destroyed by the quakes and subsequent aftershocks.
- The International Organization for Migration (IOM) estimates that over 13 million people may have been displaced.
- According to data from Data for Good at Meta, while many areas of the most heavily-affected zones in Kahramanmaraş, Adiyaman, and Hatay continues. to see severely reduced proportions of population between -24% and -38%.
- Several cities, including Sahinbey, Birecik, Sumbas, Dortyol, Hassa, Osmaniye, and Turkoglu are now registering population densities above baseline.
- The areas of greatest reduction continue to be the cities of Iskenderun, Kahramanmaraş, and Hatay, which remains more than two-thirds reduces relative to baseline more than two weeks after the quake.
- Representativeness of the Facebook mobility data remains between 2% and 11% in the cities included in the analysis.
February 17, 2023 | Turkey
This report provides information on population density changes recorded on Friday, February 17, at 08:00 GMT+3 in the regions most impacted by the earthquakes in Turkey.
Key Observations:
- For the 11 provinces that the Turkish government has named the principal affected areas of the earthquake, six are now seeing above-baseline population densities and five continue to see significant declines in densities.
- The six provinces registering consistent increases in population densities include Kilis, Elazig, Adana, Diyarbakir, Sanliurfa, and Osmaniye.
- These six provinces showed inclines ranging from 7% to 35%.
- The five provinces registering consistent declines in population densities includes Gaziantep, Hatay, Adiyaman, Karamanmaras, and Malatya.
- These five provinces showed declines ranging from -2% to -49%.
- Facebook’s data represents an overall 3% sample of the populations of the 11 affected provinces. This value ranges from a low of 1.2% in Diyarbakir and 1.9% in Sanliurfa, to highs of 4.6% in Adana and 5.1% in Kilis.
February 16, 2023 | Turkey
This report provides information on population density changes recorded on Thursday, February 16 at 7:00 a.m. local time in the regions most impacted by the earthquakes in Turkey.
Key Observations:
- On the morning of Monday, February 13, baseline Facebook population values in Hatay province were just over 71,0000; on February 16, the baseline values in the same area exceeded to 107,000, with crisis totals just under 80,000.
- This shift has only had a minor effect on percent changes from baseline population values, though.
- Most of the increases in population densities in Hatay occurred outside the city of Antakya, which is in the Hatay admin 2 boundary.
- This reflects increasing movement between cities and towns.
- Significant increases in population densities are also evident between Antakya and the Syrian border.
- The only provinces in the affected area that showed substantial decreases in population densities are the most-affected areas of Hatay, Malatya, Kahramanmara, Adiyaman, and Gaziantep.
- All other provinces show increasing population totals and percentage changes.
- Directional trends from earlier days, in terms of returns to baseline and persistence of above- or below baselines percentages remain largely unchanged.
February 15, 2023 | Turkey
This report provides a comparison of population density changes between Thursday, February 9 and Wednesday, February 15 at 7:00 a.m. local time in the regions most impacted by the earthquakes in Turkey.
Key Observations:
- Increased numbers of points recorded by Facebook mobility data indicate a significantly higher number of tiles by February 15, which are meeting privacy protection thresholds, resulting in what appears to be a much denser population pattern overall.
- The province of Hatay saw increases in the corridor between Antakya and the Syrian border above 100% compared to baseline population values.
- Similar patterns occurred outside Kahramnmaras and Osmaniye.
- Areas of downtown Gaziantep, which were between -50% – -90% on February 9, increased between 1% – 25% by February 15.
February 14, 2023 | Turkey
This report provides information on population density changes recorded on Tuesday, February 14 at 7:00 a.m. local time in the regions of Turkey most-impacted by the earthquakes.
Key Observations:
- The following areas initially saw sharp decreases in population densities, but are now showing significant rates of population increase:
- Battalgazi: variance from -75% to +75%
- Mersin: variance from -75% to +26%
- Kilis: variance from -71% to +27%
- The following areas have consistently seen increases in population densities above baseline since the earthquake struck:
- Kumlu: variance from +65% to +40%
- Reyhanli: variance from +20% to +35%
- Erdemli: variance from +65% to +35%
- The following areas have consistently seen decreases in population densities below baseline since the earthquake struck:
- Hatay: variance around -75%
- Kirikhan: variance from -55% to -60%
- Malatya: variance from -55% to -60%
- The following areas are gradually returning to baseline population densities:
- Nurhak: variance from -70% to -5%
- Ayranci: variance from -75% to -5%
- Osmaniye: variance from -75% to -9%
- Representativeness of the Facebook population data ranges from 2% to 11% of total population.
February 13, 2023 | Turkey
This report provides information on population density changes recorded on Monday, February 13 at 7:00 a.m. local time in the regions of Turkey most impacted by the earthquakes.
Key Observations
- At the time of analysis, the area located across the principal fault line from Kahramanmaras to Hatay continues to exhibit significantly decreased rates of population density.
- The greatest decrease registered was in the city of Hatay, which shows a decrease of 73% below baseline.
- Areas along the Turkish-Syrian border show significant rates of increase between 25% and 100%, while areas on the outskirts of cities, ranging from Gaziantep to Osmaniye and Adana, show pockets of sharp increase above 100%.
February 11, 2023 | Turkey
This report provides information on population density changes recorded on Saturday, February 11 at 7:00 a.m. local time in the areas most impacted by the earthquakes.
Key Observations
- The most significant areas of population decline remain in the provinces of Kahramanmaras and Hatay, both of which are registering rates of decline over 30% for several days after the quakes struck the country.
- Key cities in those provinces are registering much more significant rates of decline between 35% and 75%.
- Areas including Belen and Kumlu (in the Hatay province), Topprakale (East of Osamaniye), Reyhanli (on the Syrian border), and Altinozu (Southeast of Sntakya), however, have seen drastic reversals from population density rates up to 75% below baseline on February 6 to 8, now increasing 30% – 90% above baseline during the February 9 – 11 period.
- Representativeness of Facebook population data relative to total pre-event population values ranges between 2% and 11% at the city-level.
February 8, 2023 | Turkey; Country-Wide
This report provides information on population density changes recorded on Wednesday, February 8 at 7:00 a.m. local time across the entire country of Turkey.
Key Observations
- The zone that stretches along the line indicated by the most recent remote sensing analysis from NASA, through Hatay in the South, continues to show significant decreases in population densities, with some plummeting 85% below baseline.
- Areas immediately to the East and West, including the outskirts of Gaziantep, show persistent elevations in population densities at 100% increase or more relative to baseline.
- The larger bounding box, which now covers all of Turkey, highlights the significant rate of increase in population densities along the western coast near Adana, where there is evidence of regular transit into and out-of the city.
February 6/February; 7:00 a.m.(local time) | South Central Turkey
This report compares the patterns of population density changes between February 6 and 7 at 7:00 a.m. local time in the areas impacted by the earthquakes in Turkey.
Changes in population densities were determined using the number of users on Facebook applications during the time of analysis compared to baseline population values recorded 90-days prior to the earthquakes.
Key Observations
- Significant population decreases can be seen throughout the areas most directly impacted by seismic activity, with significant areas of increase indicating a shift in population to the eastern and western cities and towns.
February 7, 2023 | South Central Turkey
This report provides insights on population density changes in Turkey as of the early morning of February 7, one day after the 7.8 and 7.5 magnitude earthquakes struck the southern regions of the country.
The map was generated using data provided by Data for Good at Meta. For more information about the disaster population maps provided by Meta, please refer to this link.
Key Observations
- Karamanmaras, a city northwest of Gaziantep located close to the epicenter of the quakes, saw the most significant decrease in population density since the disaster took place. The area saw an overall decline of 82%.
- Towns near Karamanmaras, including Nurdagi, Merkez, and Pazarcik saw declines between 78% – 85%.
- Gaziantep showed both a sharp decline in population density in the heavily populated city center and sporadic increases in population densities throughout the more sparsely populated areas towards the south of the city.
- Dortyol and Hasanbeyli saw sharp declines in population densities followed by equally sharp increases, which may be indicative of the influx of relief and rescue personnel entering the area rather than changes in local population dynamics. Investigations into these distinctions is ongoing.
- Representativeness of the Facebook population sample ranges from a high of 6% in Sehitkamil (Gaziantep) to lows below 1% in much smaller surrounding towns.
February 6, 2023 | South Central Turkey
This report provides preliminary findings on population density changes in south central Turkey, following the 7.8 magnitude earthquake that struck the country on Monday, February 6 at 4:17 a.m. local time. The map was generated using data provided by Data for Good at Meta. For more information about the disaster population maps provided by Meta, please refer to this link.
Key Observations:
- At the time of analysis, there were severe decreases in population densities throughout all of the areas affected by the earthquake, with cities from Osmaiye to Kahramanmaras seeing decreases of up to 88% compared to baseline population values.
- An unknown portion of that decrease may be attributable to impacts on network infrastructure.
- In southern Gaziantep, significant increases in population densities could be detected shortly after the main quake took place.
- Kozan and Ceyhan also showed significant increases in population densities at the time of analysis.
February 6 (early morning), 2023 | Southwestern Turkey
This report provides data on population density changes in southwestern Turkey in the late evening of February 5 and the early morning of February 6, 2023, following the 7.8 magnitude earthquake that struck the region on Monday, February 6 at 4:17 a.m. local time.
The report was generated using data provided by Data for Good at Meta. For more information about the disaster population maps provided by Meta, please refer to this link.
Key Observations:
- Throughout the epicenter of the earthquake, which included Hatay, Osmaniye, and K. Maras, the number of users on Facebook (Meta) applications declined on average from 20% to 80% relative to baseline population values recorded 90-days prior to the disaster.
- Areas near the epicenter, including Gaziantep, Adana, and Kilis, saw sharp rates of population increase overnight.
- While there is minimal evidence of complete network outage throughout the affected area, it is nevertheless possible that some of the registered decreases in population densities were attributed to sporadic network outages at the time of analysis.
Earthquake and Floods, California, U.S. | January 2023
January 9, 2023 | Santa Barbara – Ventura, Southern California, United States
This report provides information on population density changes, baseline population vulnerabilities, and bed capacities at local healthcare facilities between Santa Barbara and Ventura, California. Data provided in this report were updated on January 10, 2023.
Key Observations:
- Despite heavy flooding as of January 9, 2023, the areas between Santa Barbara and Ventura saw minimal changes in population densities and movement.
- There were two significant exceptions to this trend: Montecito saw a decline in population density of 22% and the campus of the University of California Santa Barbara (UCSB) saw an increased density of 22%.
January 9, 2023 | Santa Cruz – Monterey, Northern California, United States
This report provides information on population density changes, baseline population vulnerabilities, and bed capacities at local healthcare facilities between Santa Cruz and Monterey, California. Data provided in this report were updated on January 10, 2023. In California, Santa Cruz and Monterey were among the most-affected areas by recent floods.
Key Observations:
- Relatively low levels of population movement were detected in Santa Cruz and Monterey at the time of analysis.
- Among higher population areas, Monterey exhibited a population decline of 8%, and Salinas a decline by 9%.
- It is likely that low levels of movement are attributed to transportation impairment from flooded roads and other obstructions.
January 5, 2023 | Northern California, United States
This report provides information on population density changes in the northern California counties affected by a 5.4 magnitude earthquake, which struck the region on January 1, 2023. Subsequent flooding caused by heavy rainfall and strong wind has exacerbated displacement throughout northern California, especially Sacramento and the San Francisco Bay Area.
Key Observations:
- Population densities remain above baseline values in pockets of Humboldt County at the time of analysis.
- Declines in population densities since the peak of holiday travel can be detected across multiple surrounding counties, including Placer, Yuba, and Butte Counties.
- Since the earthquake struck, the most significant declines in population have been in Trinity County.
- The risk of power outages, floods, and further displacement is expected to increase as multiple cyclones make their way from the Pacific Ocean toward California.
Earthquake in West Java, Indonesia | November 2022
November 21, 2022 | West Java, Indonesia
This report provides information on population density changes in the district of Cianjur in West Java, Indonesia after the region was struck by a 5.7 magnitude earthquake.
Key Observations:
- As of November 22, 2022, official totals indicated the earthquake caused 268 deaths, over 500 injuries, and nearly 60,000 people to be displaced.
- The Cianjur district experienced a dramatic, short-term population decrease, which quickly turned towards a significant increase at the time of analysis.
- Shortly after the earthquake struck the region, the recorded population decreased 38% in Cianjur, and then increased by 12% 16 hours later.
- The initial decrease in Cianjur totaled to over 33,000 individuals, which then shifted to an increase of more than 20,000.
November 21, 2022 | West Java, Indonesia
This report provides insights on population movement dynamics after the earthquake struck West Java, Indonesia.
Key Observations:
- At the time of analysis, residents who were located near the center of the earthquake moved towards the coastal area in the south and to the areas northeast of the earthquake.
- Naringgul, Tegal Buleud, Agrabinta, Cikalongkulon, Cikadu, Cihurip, and Bojonggambir all had population increases of 15% or higher.
Cyclone Sitrang, Bangladesh | October 2022
October 30, 2022 | Bangladesh (Nation-Wide)
This report provides information on population density changes as of October 30, 2022, in the areas of Bangladesh most affected by the Sitrang Cyclone, which made landfall in the country on October 25, 2022.
Key Observations:
- Roughly one week since Cyclone Sitrang struck Bangladesh, population density levels across the country have returned to pre-crisis levels.
- No district in the country is below a 4% change, relative to baseline population values.
- On average, return to baseline population density values took -3 days.
- Concerns are still running high among health officials in Bangladesh. They worry that standing water may increase mosquito breeding in the 10-14 day window post-storm, resulting in increasing vector disease cases, particularly dengue.
October 28, 2022 | Southern Bangladesh
This report provides information on population movement dynamics using data collected between October 25, when the Sitrang Cyclone first made landfall, to October 28, 2022.
Key Observations:
- Population densities at the period of analysis show that the areas most affected by the cyclone have returned to the pre-event levels.
- Three level 2 units have a trackable population slightly below the pre-event condition (b/w 6 to 15% lower than pre-event)
October 27, 2022 | Southern Bangladesh
This report provides information on population movement dynamics using data collected between October 25, when the Sitrang Cyclone first broke out, to October 27, 2022.
Key Observations:
- Population densities in the affected areas are gradually returning to pre-event levels.
- Chandpur is the only level 2admin unit with a trackable population below pre-event by 15% or greater
October 26, 2022 | Southern Bangladesh
This report provides information on population movement dynamics since Cyclone Sitrang made lanfall in southern Bangladesh on Tuesday, October 25, 2022.
Key Observations:
- Mobility data from October 26, 2022 (and updated on October 27, 2022) indicates an extremely rapid mass evacuation and then return to areas affected by the cyclone.
- Areas throughout the Eastern districts of Bangladesh saw population declines on October 25th and 26th ranging from -70% to -30% in the most affected regions. However, by the end of October 26, these districts had mostly returned to baseline population values.
- The populations of the Noakhali, Gopalganj, Munshiganj, Shariatpur, Lakshmipur, and Chandpur districts remained below baseline values at rates between -9% and -19%.
October 25, 2022 | Southern Bangladesh
This one-page report provides an overview of population movement patterns after Cyclone Sitrang made landfall on October 25, 2022. The percent changes included in this report are relative to number of Facebook users detected.
Key Observations:
- The Southern regions of Bangladesh were most affected by the landfall of the cyclone.
- Level-2 administrative units with the greatest population displacement include: Lakshipur, Chandpur, Munshiganj, Shariatpur, Noakhali, and Gopalganj.
- Lakshmipur, Chandpur, and Munshiganj saw the most significant declines in population densities, with averages between -36% and -54%.
Tropical Storm Julia | October 2022
October 13, 2022 | El Salvador
This report highlights changes in population densities as of October 13, 2022 along the west coast of El Salvador, where destruction from Tropical Storm Julia is most severe.
Key Observations:
- Population densities in the several areas along the west coast of El Salvador continued to rise at the time of analysis (October 13, 2022). Population levels have increased since the last period of analysis on October 12, indicating that there is a steady stream of return of people temporarily displaced by the storm.
- Despite rising densities in the areas located inland from the western coastline and in the southern region of the country, populations along the coast line are still below baseline levels. Even though these areas are below baseline values, they have shown increased densities since our previous reports on October 10, when displacement was at its peak.
October 13, 2022 | Nicaragua, Western Coastline
This report highlights changes in population densities as of October 13, 2022 along the west coast of Nicaragua, where destruction caused by Tropical Storm Julia was most severe.
Key Observations:
- Populations in the area of analysis continue to rise to (or near) baseline population levels taken prior to Tropical Storm Julia’s landfall in Nicaragua.
- Similarly to previous reports, the city of Rivas still shows a population density well below baseline values. However, the percentage decrease from baseline is less than our previous report on October 12, 2022.
- Population levels increased in level 1 administrative units where displacement was most severe after Julia’s landfall.
October 12, 2022 | El Salvador, Western Coastline
This report highlights changes in population densities along the west coast of El Salvador, where Tropical Storm Julia first made landfall in the country.
Key Observations:
- Populations began to rise in the areas most affected by the tropical storm, indicating that people are returning to their original locations after being temporarily displaced.
- Population densities along the western coastline are still below baseline values prior to landfall. However, these areas showed increasing densities compared to the previous report published on October 10, 2022, when displacement was at its peak.
- Population densities identified from Facebook data remains high in the top level 1 administrative unites with the biggest population drop, indicating the patterns detected are highly reliable.
October 12, 2022 | Nicaragua, Western Coastline
This report highlights changes in population densities along the west coast of Nicaragua, where destruction caused by Tropical Storm Julia was most severe.
Key Observations:
- Population densities in most level 1 administrative units of Nicaragua continued to rise to — or near — the baseline population values prior to landfall at the time of analysis.
- Rivas, Nicaragua still showed a population density significantly below its pre-landfall levels.
- Populations in the other areas along the country’s western coastline have returned to — or near — baseline population values.
October 11, 2022 | El Salvador Coastline
As of the night of October 11, 2022, most areas of El Salvador that were directly impacted by Hurricane Julia have returned to baseline population levels. This report highlights trends in population movement patterns as rescue organizations scramble to respond to the destruction caused by Hurricane Julia.
Key Observations:
- Significant numbers of reduced populations could be detected in areas around the capital city San Salvador, (-3%), Antiguo Custalacan (-4%), as well as the smaller surrounding towns in the La Libertad district.
October 11, 2022 | Nicaragua, Caribbean Coast
This report highlights population density change from baseline along the west coast of Nicaragua during the peak of displacement.
Key Observations:
- Population densities in the majority of level 1 admin units in Nicaragua have risen to nearly baseline population levels, which were recorded prior to the storm’s landfall.
- Rivas, a city in southwestern Nicaragua, showed population values significantly below the pre-landfall levels at the time of analysis.
- As of October 11, populations in other coastal regions have returned to — or near — pre-event baseline levels.
October 10, 2022 | Northern & South-Central El Salvador
This report highlights changes in population densities in northern and south-central regions of El Salvador during the peak of displacement. Specific areas of focus include Usulutan, La Paz, La Libertad, and Sonsonate.
Key Observations:
- Decreases in population densities were significant across the north-central and south-central regions of El Salvador, especially in areas along the west coast.
- Usulutan, La Paz, La Libertad, and Sonsonate saw the most significant declines in population densities at the time of analysis.
- Population densities in this region have since began to increase as of October, 11.
October 10, 2022 | Southwest El Salvador
Hurricane Julia made its way up the western coast of El Salvador on October 10, 2022, affecting a number of coastal regions. This report highlights changes in population densities after Julia made landfall.
Key Observations:
- Areas showing significant population declines at the time of analysis include the near-coastal areas of Alegria, Concepcion Batres, Berlin, Jucaran, and Tecapan. All of these areas saw declines between 25% and 38% on October 9 and 10.
- Representativeness of Facebook population in Alegria in particular is relatively high, including nearly 10% of the local population in the baseline sample.
October 9, 2022 | Nicaragua
Hurricane Julia made landfall on the Caribbean coast of Nicaragua early on Sunday, October 9 as a Category 1 Storm. The storm had sustained winds of 85 mph when it moved onshore near Laguna de Perlas around 1:15 AM (GMT-6).
This report provides an overview of population density changes from baseline numbers after the hurricane made landfall. A more granular view of population movement in Nicaragua can be found here. A report with Admin Level 3 data can be found here.
Catastrophic Flooding in Pakistan | October 2022
October 6 – October 9, 2022 | Pakistan (National Level)
This report provides an overview of population density changes at a national level.
Key Observations:
- The western regions of Pakistan experienced the largest declines in population density from August 24 to 30, 2022, reflecting the period of peak flash flooding in Balochistan.
- The average population density has gradually increased across regions throughout the country after August 30th, regardless of the number of Facebook users in each region relative to total population
- Among all admin level 2 units, Sibi and Nasirabad saw the lowest proportion of population return in the wake of peak flooding.
- The greatest increases in population density for urban areas directly proximate to heavy flooding occurred in Multan and Peshawar between August 29 and Sept 9.
October 6 – October 9, 2022 | Balochistan Province
This report provides an overview of population density and mobility changes in Balochistan, Pakistan.
Key Observations:
- The majority of administrative units in Balochistan saw significant population decreases compared to pre-event baseline during the peak of displacement.
- Kalat, Nasirabad, and Quetta recorded significant population drops from August 23 to September 4.
- Population remained much lower than pre-event baseline levels in Sibi for more than30 days. This trend started on August 13 and did not change until September 20.
- During the peak of population displacement (August 23 – September 4), mobility across level 2 units dropped everywhere except Makran.
October 6 – October 9, 2022 | Sindh Province
This report provides an overview of population density changes in the Sindh province of Pakistan.
Key Observations:
- Sindh recorded two peaks of population displacement, one before August 20, the other from August 23 to 29. In Sindh, population remained much lower than pre-event baseline for a shorter period of time compared to Balochistan.
- Sukkur’s population remained lower than baseline for a longer time than other level 2 admin units in Sindh.
- During both peaks of population displacement, rates of mobility also dropped significantly in Sindh. Although some increases in rates of mobility movement could be detected in level 2 admin units in Sindh on August 21 & 22, those increases may also be attributed to the urban commuting pattern that occurs periodically in these areas.
- Hyderabad, Larkana, Mirpur Khas, and Sukkur are the level 2 admin units with the most prominent decreases in mobility.
October 6 – October 9, 2022 | Khyber-Pakhtunkhwa Province
This report provides an overview of population density changes in the Khyber-Pakhtunkhwa province of Pakistan
Key Observations:
- Khyber-Pakhtunkhwa (K-P) recorded two peaks of population displacement, one beforeAugust 20, the other from August 23 to 29.
- The population of Dera Ismail Khan remained lower than baseline for longer than other level 2 admin units in K-P.
- Hazara and Makaland witnessed the longest period with significant decrease in mobility.
- The decrease in mobility for K-P coincided with the two major peaks of population displacement and lasted until September 21.
Hurricane Ian | September – October 2022
October 9, 2022 | Southwest Florida, United States
This report provides an overview of population movement and density changes as of October 9, 2022 throughout southwest Florida.
Key Observations:
- A number of towns that were heavily impacted by Hurricane Ian are still showing significant reductions in population densities. In particular, Fort Meyers Beach and Sanibel Island show either reductions approaching 100% or complete lack of signal.
- Areas including St. James City, Pineland, Bokeelia, Pine Island Center, and Mattacha, which have seen similar extreme losses in population in earlier days post-landfall began to see signs of recovery in population as of October 8.
- More than half of the towns and cities featured in this report indicate full recovery to pre-landfall baseline populations.
October 4, 2022 | Southwest Florida, United States
This report provides an overview of population movement and vulnerability data (collected on October 4) from areas throughout southwest Florida.
Key Observations:
- As of October 4, widespread power outages persisted across the entirety of southwest Florida, proximate to the landfall of Hurricane Ian.
- Rates of return throughout the affected areas are above baseline except for the most affected counties (i.e. Charlotte and Lee).
- Even in Charlotte and Lee counties, population densities have nearly returned to baseline numbers.
- The rate of return remains linear day-over-day, which forecasts full return across the region by October 10th or 11th.
October 2, 2022 | Florida, United States
As of October 2, 2022, counties across Florida that have been most impacted by Hurricane Ian continue to see widespread power outages and reductions in population densities.
This report provides updated data on population movement and vulnerabilities.
Key Observations:
- Charlotte and Lee Counties, located on the southwestern coast of Florida, saw population reductions between 14% and 26% at the time of analysis.
- Most counties surrounding Charlotte and Lee, extending to the eastern side of the state, have seen relatively significant increases in population densities.
- The most proximate increase to the western area of landfall occurred in Hillsborough County, which saw an increase in Facebook users of nearly 26,000 (9%) relative to baseline values of 90-days pre-crisis.
October 1, 2022 | Southwest Florida, United States (American Community Survey Data)
This report provides a granular view of population movement and community vulnerability dynamics for the areas along the southwest coast of Florida, which have been most impacted by Ian.
Key Observations:
- As of October 1, the areas showing the greatest decrease in population include Fort Meyers Beach (-94%), St. James City (-93%), and Pine Island Center (-93%). These areas show no current signs of return, given the level of infrastructure damage.
- Evacuations throughout the region were substanial and widespread, with many cities and towns still reduced by 10% or more (as of October 1).
- However, many areas have seen significant rates of return above baseline at the time of analysis. Most notable among these areas is the mid-sized town of Lehigh Acres, which was above the baseline population by 9% (with an increase of nearly 2,000 people at the time of analysis).
October 1, 2022 | Southwest Florida, United States
This report summarizes population movement patterns and vulnerability indicators for the coastal southwest of Florida in the aftermath of Hurricane Ian’s landfall in the state.
Key Observations:
- Steady rates of return were detected in most Florida counties at the time of analysis on October 1.
- Sarasota, Hardee, DeSoto, Lee, and Charlotte counties remain at 10% below baseline population values, with Charlotte seeing the most severe ongoing decline at -40%.
- However, the rates of population decrease are in comparison to peak declines of roughly 65% in the most affected areas.
- The more northern and inland counties of Manatee, Hendry, Glades, Collier, and Highland are all seeing population increases relative to baseline values at the time of analysis. The increases range from 2% to 14%.
October 1, 2022 | East Coast of South Carolina, United States
This report summarizes population movement patterns and vulnerability indicators for the East Coast of South Carolina after Hurricane Ian made landfall in the state.
Key Observations:
- The greatest decreases in population occured in the counties of Horry and Brunsqick, located north of Charleston. These counties saw consistent day-over-day declines of 13% to 14%, as compared to 5% to ^% in the more southern counties of Charleston and Brunswick.
- The counties inland from these coastal areas generally saw either no change or a slight increase in population, which reflects the relatively short average distances traveled by evacuees from Horry and Brunswick.
- The population of Horry, Brunswick, and Georgetown are generally more vulnerable to disaster impacts. The number of residents over the age of 65 ranges as high at 31%, and poverty rates range as high as 16%.
September 30, 2022 | Charleston Region, South Carolina, United States
This report highlights age vulnerabilities in the regions affected by Hurricane Ian after it made landfall in South Carolina. The report also sheds light on population movement patterns in and around Charleston.
Key Observations:
- Age vulnerabilities are relatively significant in this region. The counties in the immediate path of the hurricane range from a low of 14% of the population over the age of 65 to a high of 28%.
- In some areas, particularly on a number of islands off the Atlantic coast, the proportion of residents over the age of 65 grows to 40% or more of the total population.
- Orangeburg, Williamsburg, and Clarendon Counties are the areas in the hurricane’s path with the highest proportion of people living in poverty, with rates between 21% and 23%.
- South Carolina has not yet experiences power outages to any significant degree. However, the recent experience in Florida shows that widespread outages are likely. Rates of users of power-dependent medical equipment are relatively low to in-line with the national average, with the exception of Horry County, which has a rate of DME users roughly 4x the average U.S. county.
September 28, 2022 | Charlotte County, Western Florida, United States (Post-Landfall)
This is a specific report for Charlotte County, Florida, after Hurricane Ian made landfall on Thursday, September 28 at 1800 EDT. The report shows changes in population density as well as data on community vulnerabilities and power outages.
Key Observations:
- There was a large decrease in population density by 74% in Charlotte County, suggested from our daily analyses that people continued to evacuate shortly before the hurricane made landfall.
- According to the American Community Survey (ACS), ~29% of Charlotte County’s population are 65 years of age or older, with a higher percentage of those over 65 in the path of the hurricane and in the coastal areas.
- At the time of analysis, there was a significant increase in power outages in the county. Our power data sources are unable to show outages at the place or sub-county level at this time.
September 28, 2022 | Lee County, Western Florida, United States (Post-Landfall)
This is a specific report for Lee County, Florida, after Hurricane Ian made landfall on Thursday, September 28 at 1800 EDT. The report shows changes in population density as well as data on community vulnerabilities and power outages.
Key Observations:
- There was a large decrease in population density by 65% in Lee County, suggested from our daily analyses that people continued to evacuate shortly before the hurricane made landfall.
- According to the American Community Survey (ACS), ~29% of Lee County’s population are 65 years of age or older, with a higher percentage of those over 65 in the path of the hurricane and in the coastal areas.
- At the time of analysis, there was a significant increase in power outages in the county. Our power data sources are unable to show outages at the place or sub-county level at this time.
September 28, 2022 | Central & Eastern Florida, United States
Hurricane Ian passed over the Central and Eastern regions of Florida on Thursday, September 29 at Category 1 strength. This report provides information on Ian’s forecasted path, and the densities and vulnerabilities within it.
Key Observations:
- Power outages were not prevalent throughout central and eastern Florida at the time of analysis. Only modest outages reported in Volusia, Brevard, and Orange Counties.
- Most areas in the region showed population increases, due in part to evacuations ordered in Southwestern Florida, which bore the brunt of the storm.
- Coastal areas, including Daytona Beach and Cocoa Beach, showed modest declines between 1% and 9%. Areas from Kissimmee to Alafaya showed increases in population between 7% and 10%.
- Volusia and Brevard Counties have a high percentage of elderly residents at 24%, with over 13,000 users of power-dependent medical devices between the two counties.
- Orange county has a younger population compared to the other nearby, with only 12% of residents over the age of 65. Given its relatively higher total population, it has roughly the same average number of power-dependent medical device users as Volusia and Brevard.
September 28, 2022 | Charlotte & Lee Counties, Florida, United States (Combined Report)
This report provides data on Hurricane Ian’s predicted path after making landfall on the west coast of Florida. Additionally, the report outlines population mobility and power outage data around Charlotte and Lee Counties, which were most affected by the storm’s initial landfall.
Key Observations:
- Charlotte and Lee Counties saw population reductions between 65% and 74%. These reducations took place a day before the hurricane made landfall.
- The report shows that more than 100,000 people still remained in heavily-flooded coastal areas (i.e. Charlotte, Lee, Sarasota, DeSoto Counties) at the time of analysis.
- No town or municipality in the geographic area of focus reported increasing population densities.
- On the lower end, areas such as Sebring and Lakewood Ranch showed declining population densities between 1% and 22%.
- On the higher end, areas such as Cape Coral and Port Charlotte showed declining population densities of 74% or more.
- Severe power outages took place in Manatee, Collier, Lee, and Sarasota Counties, affecting 100% of customers. Cumulatively, those counties contain nearly 17,000 people registered as using power dependent medical devices.
September 27, 2022 | West Coast Florida, United States
This report summarizes vulnerability and mobility data of the regions south of Tampa Bay, Florida, namely Charlotte, Sarasota, Lee, and DeSoto Counties. This region was predicted to be the initial site of landfall in the United States.
Key Observations:
- Although relatively significant decreasing movement trends can be detected, especially in smaller coastal communities, some areas are showing increasing population trends over September 26 and 27.
- Charlotte County, in particular, was still showing a large number of people who have not evacuated at the time of analysis.
- Each of the four counties (Charlotte, Sarasota, Lee, DeSoto) experienced power outage prior to storm’s landfall.
- Lee and Sarasota counties experienced the highest rates of power outage at the time of analysis. These counties also contain numbers of residents with power dependent medical devices above the state average.
Catastrophic Floods in Pakistan | August – September 2022
September 13, 2022 | Pakistan (National-Level)
The updated maps below shed light on the evolving displacement patterns as floods continue to devastate Pakistan. A new data layer has been added in the maps below to show the population change at administrative level 2, as the tile level population update has recently encountered issues.
Key Observations:
- Most areas, especially the populous cities in the Northeast part of Pakistan, have returned to pre-crisis population levels at the time of analysis.
- The flooded zones of the south still experienced significant decreases in population densities as of September 13, 2022.
- Population mobility trends show heavy movement out of areas surrounding Hyderabad and Karachi, and into more northern cities like Lahore, Multan, and Quetta.
September 5, 2022 | Pakistan (National-Level)
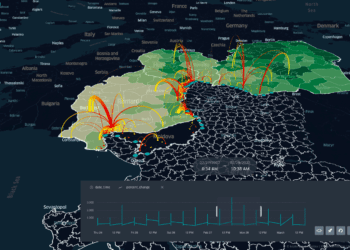
The interactive map below shows population movement patterns driven by recent floods in Pakistan between August 13, 2022 and September 5, 2022.
Interpretation:
- The red arrows on the map show the directional patterns of population movement. The size (width) of the arrows correlates with the the volume of individuals displaced from the selected origins.
- The larger the arrow, the greater number of movement vectors.
- Transparency of arrows indicates the baseline population traveling between the origin and the destination under the pre-crisis situation.
- The maps were generated using data provided by Data for Good at Meta. For more information about the disaster population maps provided by Data for Good at Meta, please refer to this link.
August 30, 2022 | Pakistan (National-Level)
This map shows population changes compared to pre-crisis baseline in Pakistan on a daily basis for all level 3 administrative units for Pakistan.
Data Sources & Interpretation:
- The data is time-enabled to show the change from August 13, 2022 to the latest date when population change data harvested by Data for Good at Meta is available.
- Population maps provided by Data for Good at Meta are generated based on users of Facebook.
- Data on flood extent is gathered using the Visible Infrared Imaging Radiometer Suite (VIIRS), an instrument that collects visible and infrared images and global observations of the land, atmosphere, cryosphere, and oceans.
Mill Fire, Siskiyou County, California, United States | September 2022
September 5, 2022 | Siskiyou, Trinity, Shasta Counties, California, United States
This report highlights the most recent changes in population densities in the areas most affected by the Mill Fire in northern California, namely Siskiyou, Trinity, and Shasta Counties.
*Note: As of September 5, the fire perimeter and power outage data for the Mill Fire report is not displaying properly.
Key Observations:
- The most populous counties affected by the fire are Siskiyou County, Trinity County, and Shasta County, with pre-crisis populations of 6,145, 1,360, and 31,816 respectively
- At the time of analysis, the population density of Siskiyou County increased by 13% from baseline values.
- Trinity County’s population increased by 5%.
- Shasta County’s population decreased by 3%.
March 26, 2022 | Population Density Change Map Analysis of Countries Bordering Western Ukraine
26 March, 2022
Summary: The following data maps show population density changes between March 20, 2022 and March 26, 2022 in Poland, Hungary, Romania, and Slovakia.
Data Sources: These data visualizations were generated using mobility data from Meta (formerly Facebook,) border checkpoint data from the Humanitarian Data Exchange (HDX), refugee reception point data from the Government of Poland, and regional data gathered from the European Commission using NUTS-3 administrative units.
Poland
Hungary
Romania
Slovakia
March 22, 2022 | Population Density Change Map Analysis of Countries Bordering Western Ukraine
22 March, 2022
Summary: The following data maps show population density changes between March 16, 2022 and March 22, 2022 in Poland, Hungary, Romania, and Slovakia.
Data Sources: These data visualizations were generated using mobility data from Meta (formerly Facebook,) border checkpoint data from the Humanitarian Data Exchange (HDX), refugee reception point data from the Government of Poland, and regional data gathered from the European Commission using NUTS-3 administrative units.
Poland
Hungary
Romania
Slovakia
March 20, 2022 | Population Density Change Map Analysis of Countries Bordering Western Ukraine
20 March, 2022
Summary: The following data maps show population density changes between March 14, 2022 and March 20, 2022 in Poland, Hungary, Romania, and Slovakia.
Data Sources: These data visualizations were generated using mobility data from Meta (formerly Facebook,) border checkpoint data from the Humanitarian Data Exchange (HDX), refugee reception point data from the Government of Poland, and regional data gathered from the European Commission using NUTS-3 administrative units.
Poland
Hungary
Romania
Slovakia
March 19, 2022 | Population Density Change Map Analysis of Countries Bordering Western Ukraine
19 March, 2022
Summary: The following data maps show population density changes between March 14, 2022 and March 19, 2022 in Poland, Hungary, Romania, and Slovakia.
Data Sources: These data visualizations were generated using mobility data from Meta (formerly Facebook,) border checkpoint data from the Humanitarian Data Exchange (HDX), refugee reception point data from the Government of Poland, and regional data gathered from the European Commission using NUTS-3 administrative units.
Poland
Hungary
Romania
Slovakia
Interpretation
- Decreases in population density changes are reflected by brown dots.
- Increases in population density changes are reflected by green dots.
- Similarly to previous maps, the saturation and transparency of the colored dots reflect the strength of changes in population densities. The transparency of the dots also reflects the confidence in data representativeness.
- Higher saturation = greater rate of change.
- Lower saturation = lower rate of change.
- Low transparency/high saturation = higher confidence in data representativeness.
- High transparency/low saturation = lower confidence in data representativeness
March 16, 2022 | Population Density Change Map Analysis of Countries Bordering Western Ukraine
16 March, 2022
Summary: The following data maps show population density changes between March 10, 2022 and March 16, 2022 in Poland, Hungary, Romania, and Slovakia.
Data Sources: These data visualizations were generated using mobility data from Meta (formerly Facebook,) border checkpoint data from the Humanitarian Data Exchange (HDX), refugee reception point data from the Government of Poland, and regional data gathered from the European Commission using NUTS-3 administrative units.
Poland
Hungary
Romania
Slovakia
March 15, 2022 | Population Density Change Map Analysis of Countries Bordering Western Ukraine
15 March, 2022
Summary: The following data maps show population density changes between March 9, 2022 and March 15, 2022 in Poland, Hungary, Romania, and Slovakia.
Data Sources: These data visualizations were generated using mobility data from Meta (formerly Facebook,) border checkpoint data from the Humanitarian Data Exchange (HDX), refugee reception point data from the Government of Poland, and regional data gathered from the European Commission using NUTS-3 administrative units.
Poland
Hungary
Romania
Slovakia
March 14, 2022 | Population Density Change Map Analysis of Countries Bordering Western Ukraine
14 March, 2022
Summary: The following data maps show population density changes between March 8, 2022 and March 14, 2022 in Poland, Hungary, Romania, and Slovakia.
Data Sources: These data visualizations were generated using mobility data from Meta (formerly Facebook,) border checkpoint data from the Humanitarian Data Exchange (HDX), refugee reception point data from the Government of Poland, and regional data gathered from the European Commission using NUTS-3 administrative units.
Poland
Hungary
Romania
Slovakia
March 13, 2022 | Population Density Change Map Analysis of Countries Bordering Western Ukraine
13 March, 2022
Summary: The following data maps show population density changes between March 7, 2022 and March 13, 2022 in Poland, Hungary, and Romania.
Note: Slovakia did not have data available for March 13, 2022.
Data Sources: These data visualizations were generated using mobility data from Meta (formerly Facebook,) border checkpoint data from the Humanitarian Data Exchange (HDX), refugee reception point data from the Government of Poland, and regional data gathered from the European Commission using NUTS-3 administrative units.
Poland
Hungary
Romania
March 8, 2022 | Social Connectedness & Population Density Change Map Analyses of Countries Bordering Western Ukraine
8 March, 2022
Summary: The following data maps show population density changes between March 3, 2022 and March 8, 2022 in Poland, Hungary, Slovakia, and Romania compared with their social connectedness with Ukraine.
Data Sources: These data visualizations were generated using mobility data from Meta (formerly Facebook,) Meta’s Social connectedness index (SCI,) a measurement based on Facebook friendship connections of Ukraine users, and regional data gathered from the European Commission using NUTS-3 administrative units.
Poland
Hungary
Romania
Slovakia
All Countries: SCI & Population Density Change
Interactive Map: Population Density Change Map Analysis of Countries Bordering Western Ukraine
7 March, 2022
Summary: The interactive map below shows changes in population densities and refugee reception points along the Poland-Ukraine border as of March 7, 2022.
Data Sources: This map was generated using human mobility data gathered from Meta’s Data for Good initiative and border checkpoint information from HDX.
Note: To interact with the map below, click and drag the time selection tool. Information relating to the selected timeframe will be displayed above the time selection tool. Users may also move the map by clicking and dragging your cursor until the desired region is shown. Users may disable 3D mapping visualization, access the legend, draw a specific region on the map, or change the language by clicking the widgets displayed in the upper right hand corner.
Interactive Map: Changes in Population Densities Along the Poland-Ukraine Border
March 6, 2022 | Population Density Change Map Analysis of Countries Bordering Western Ukraine
6 March, 2022
Summary: The following data maps show population density changes between March 1, 2022 and March 6, 2022 in Poland, Hungary, Slovakia, and Romania.
Data Sources: These data visualizations were generated using mobility data from Meta (formerly Facebook,) and regional data gathered from the European Commission using NUTS-3 administrative units.
Poland
Hungary
Romania
Slovakia
March 5, 2022 | Population Density Change Map Analysis of Countries Bordering Western Ukraine
5 March, 2022
Summary: The following data maps show population density changes between February 24, 2022 and March 5, 2022 in Poland, Hungary, Slovakia, and Romania.
Data Sources: These data visualizations were generated using mobility data from Meta (formerly Facebook,) and regional data gathered from the European Commission using NUTS-3 administrative units.
Poland
Hungary
Romania
Slovakia
March 2, 2022 | Population Density Change Map Analysis of Countries Bordering Western Ukraine
2 March, 2022
Summary: The following data maps show population density changes between February 24, 2022 and March 2, 2022 in Poland, Hungary, Slovakia, and Romania.
Data Sources: These data visualizations were generated using mobility data from Meta (formerly Facebook,) and regional data gathered from the European Commission using NUTS-3 administrative units.
Poland
Hungary
Romania
Slovakia
February 26, 2022 | Population Density Change Map Analysis of Countries Bordering Western Ukraine
26 February, 2022
Summary: The following data map shows population density changes as of February 26, 2022 along the Poland-Ukraine border.
Data Sources: These data visualizations were generated using mobility data from Meta (formerly Facebook,) border checkpoint information from HDX, and regional data gathered from the European Commission using NUTS-3 administrative units.
Population Density Changes: Poland-Ukraine Border
February 26, 2022 | Population Density Change Map Analysis of Countries Bordering Western Ukraine
26 February, 2022
Summary: The following data map shows population density changes and refugee reception points along the Poland-Ukraine border as of February 26, 2022.
Data Sources: These data visualizations were generated using mobility data from Meta (formerly Facebook,) border checkpoint information from HDX.
Population Density Changes & Refugee Reception Points: Poland-Ukraine Border
February 26, 2022 | Population Density Change Map Analysis of Countries Bordering Western Ukraine
25 February, 2022
Summary: The following data map shows population density changes and refugee reception points along the Poland-Ukraine border as of February 25, 2022.
Data Sources: These data visualizations were generated using mobility data from Meta (formerly Facebook,) border checkpoint information from HDX.
Population Density Changes: Poland-Ukraine Border
Widespread Power Outages Caused by Winter Storms, United States
Report: Power-Dependent Medical Equipment Users Affected by Power Outages in Tennessee, West Virginia, Pennsylvania, Ohio, Texas, and New York
Date: 4 February, 2022
Note: This data visualization originally appeared on Direct Relief news service.
Storm Landon, Northern Texas, United States
Report: Power-Dependent Medical Equipment Users Affected by Power Outages in Texas
Date: 3 February, 2022
Note: This data visualization originally appeared on Direct Relief news service.
Marshall Fire, Boulder County, Colorado, United States
Report: Population density changes throughout Boulder County, Colorado.
Date: 30 December, 2021 – 5 January, 2022 (2359 hrs)
Report: Population movement matrix of regions throughout Boulder County, Colorado.
Date: 31 December, 2021
Date: 4 January, 2022
Long-track Tornado in Western Kentucky, Central United States
Report: Population Density Changes
Date: 14 December, 2021 (2359 hrs)
Date: 11 – 12 December, 2021 (2100 – 2320 hrs)
Caldor Fire in El Dorado County, California
Report: Population Density Changes
Date: 6 – 7 September, 2021 (1600 – 2359 hrs)
ArcGIS Layer – Population Density Changes
Period: 23 – 29 August, 2021
Integrate Population Density time lapse changes for Caldor directly onto ArcGIS maps using this link: https://arcg.is/1KOmev0
Archived Reports
Period: 29 August – 5 September, 2021
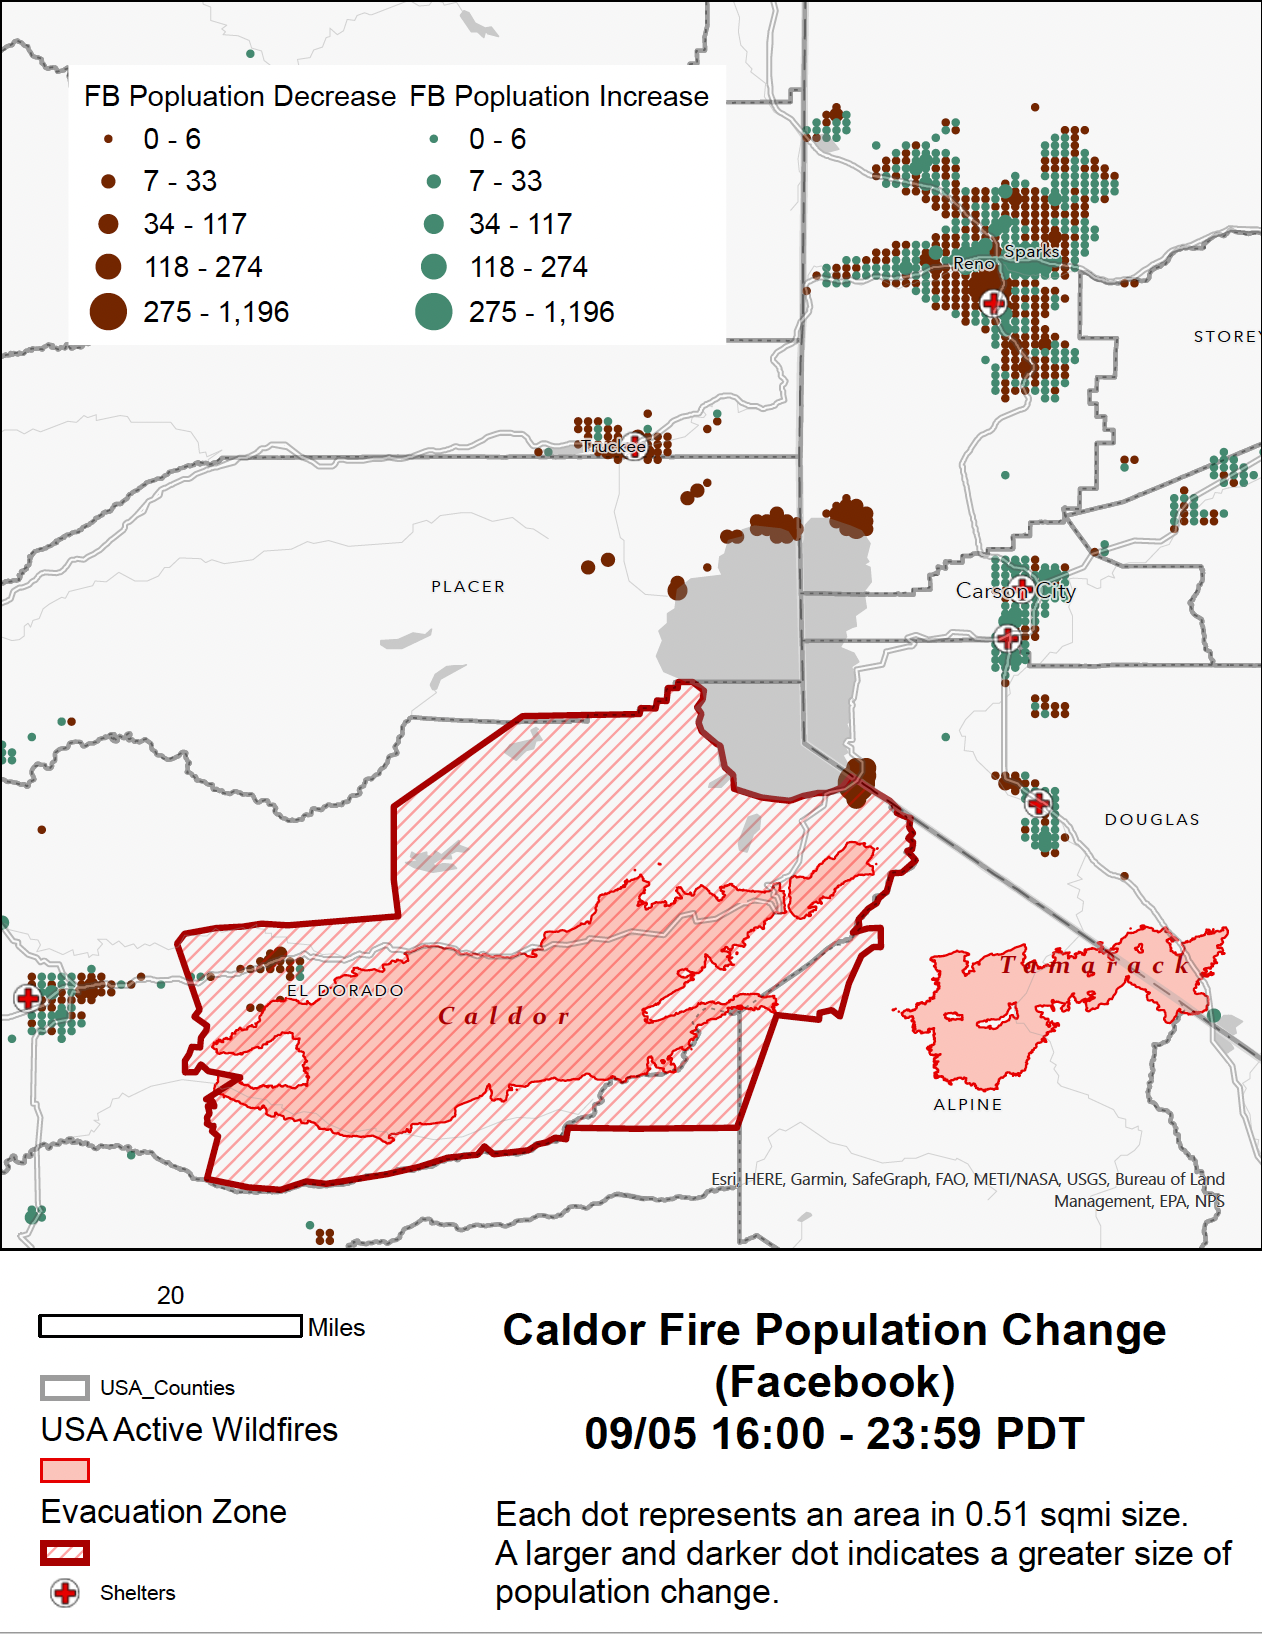
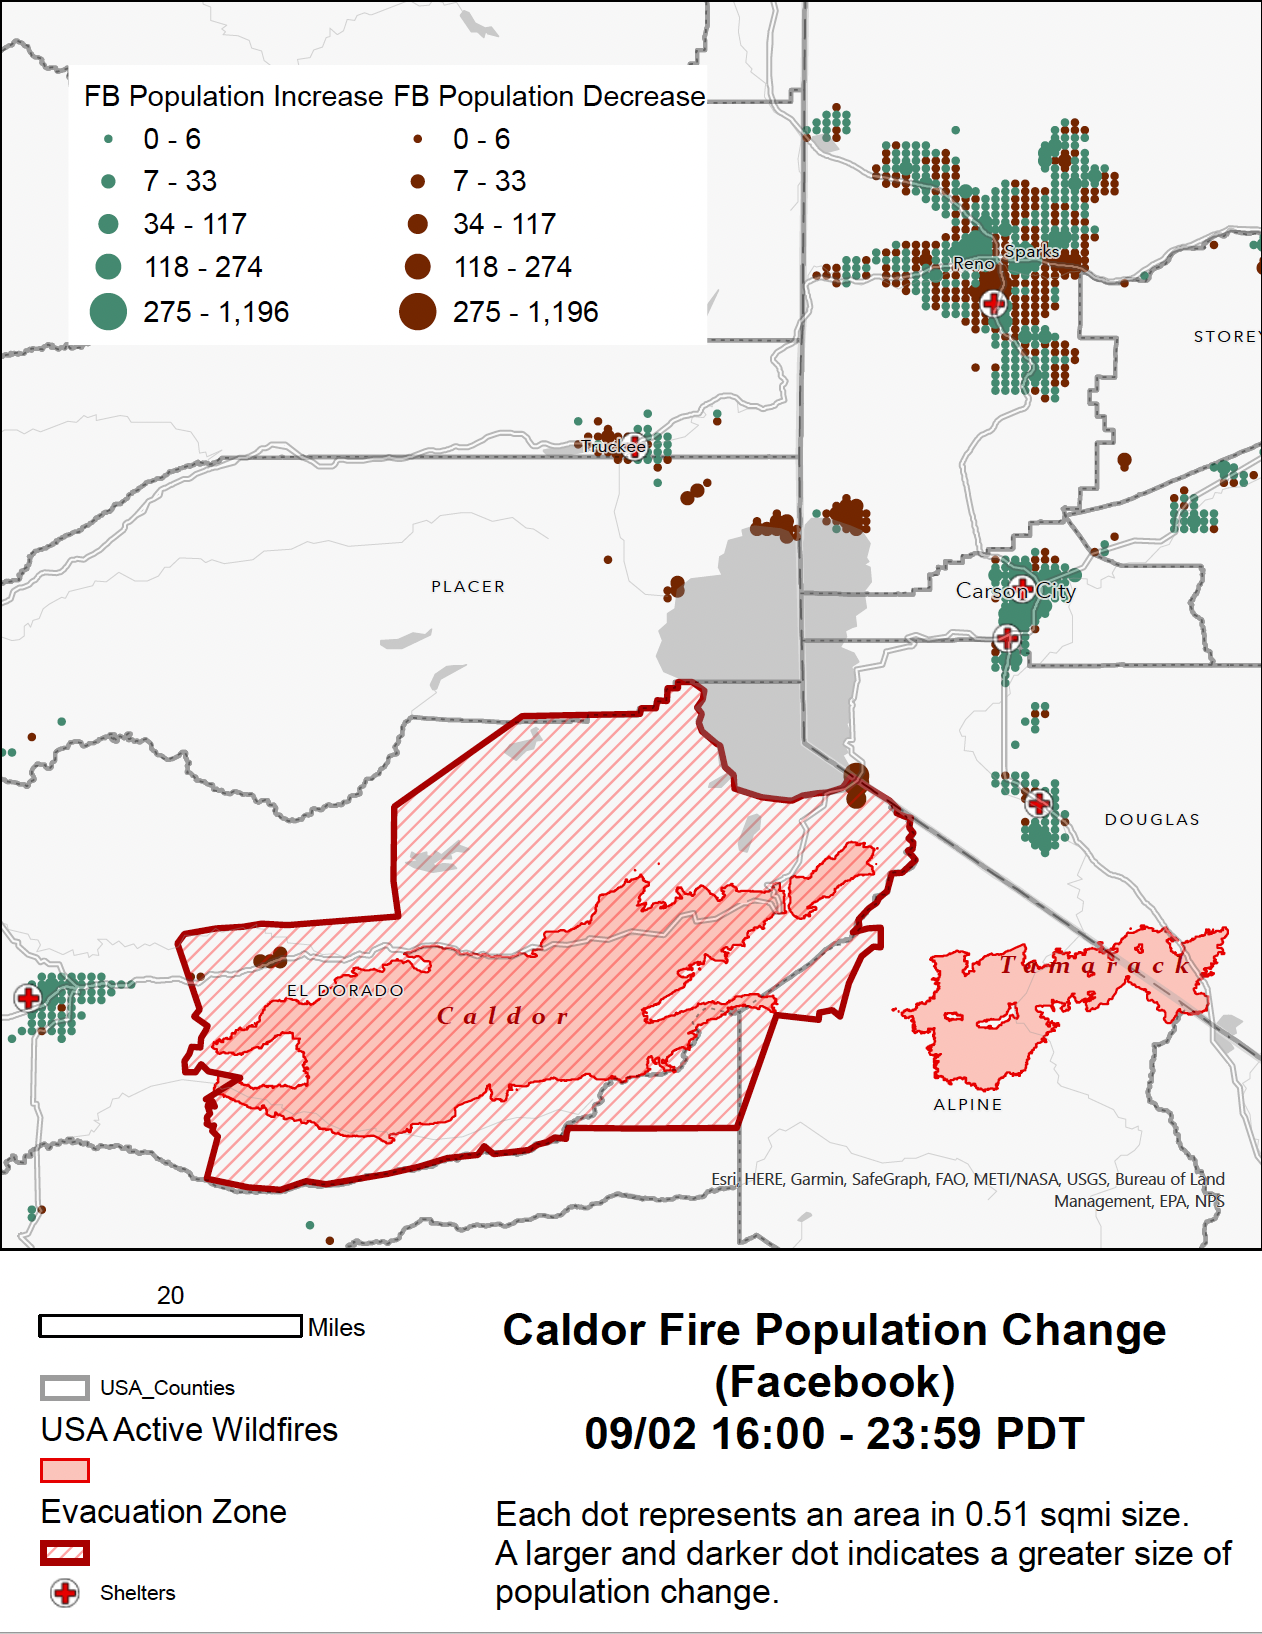
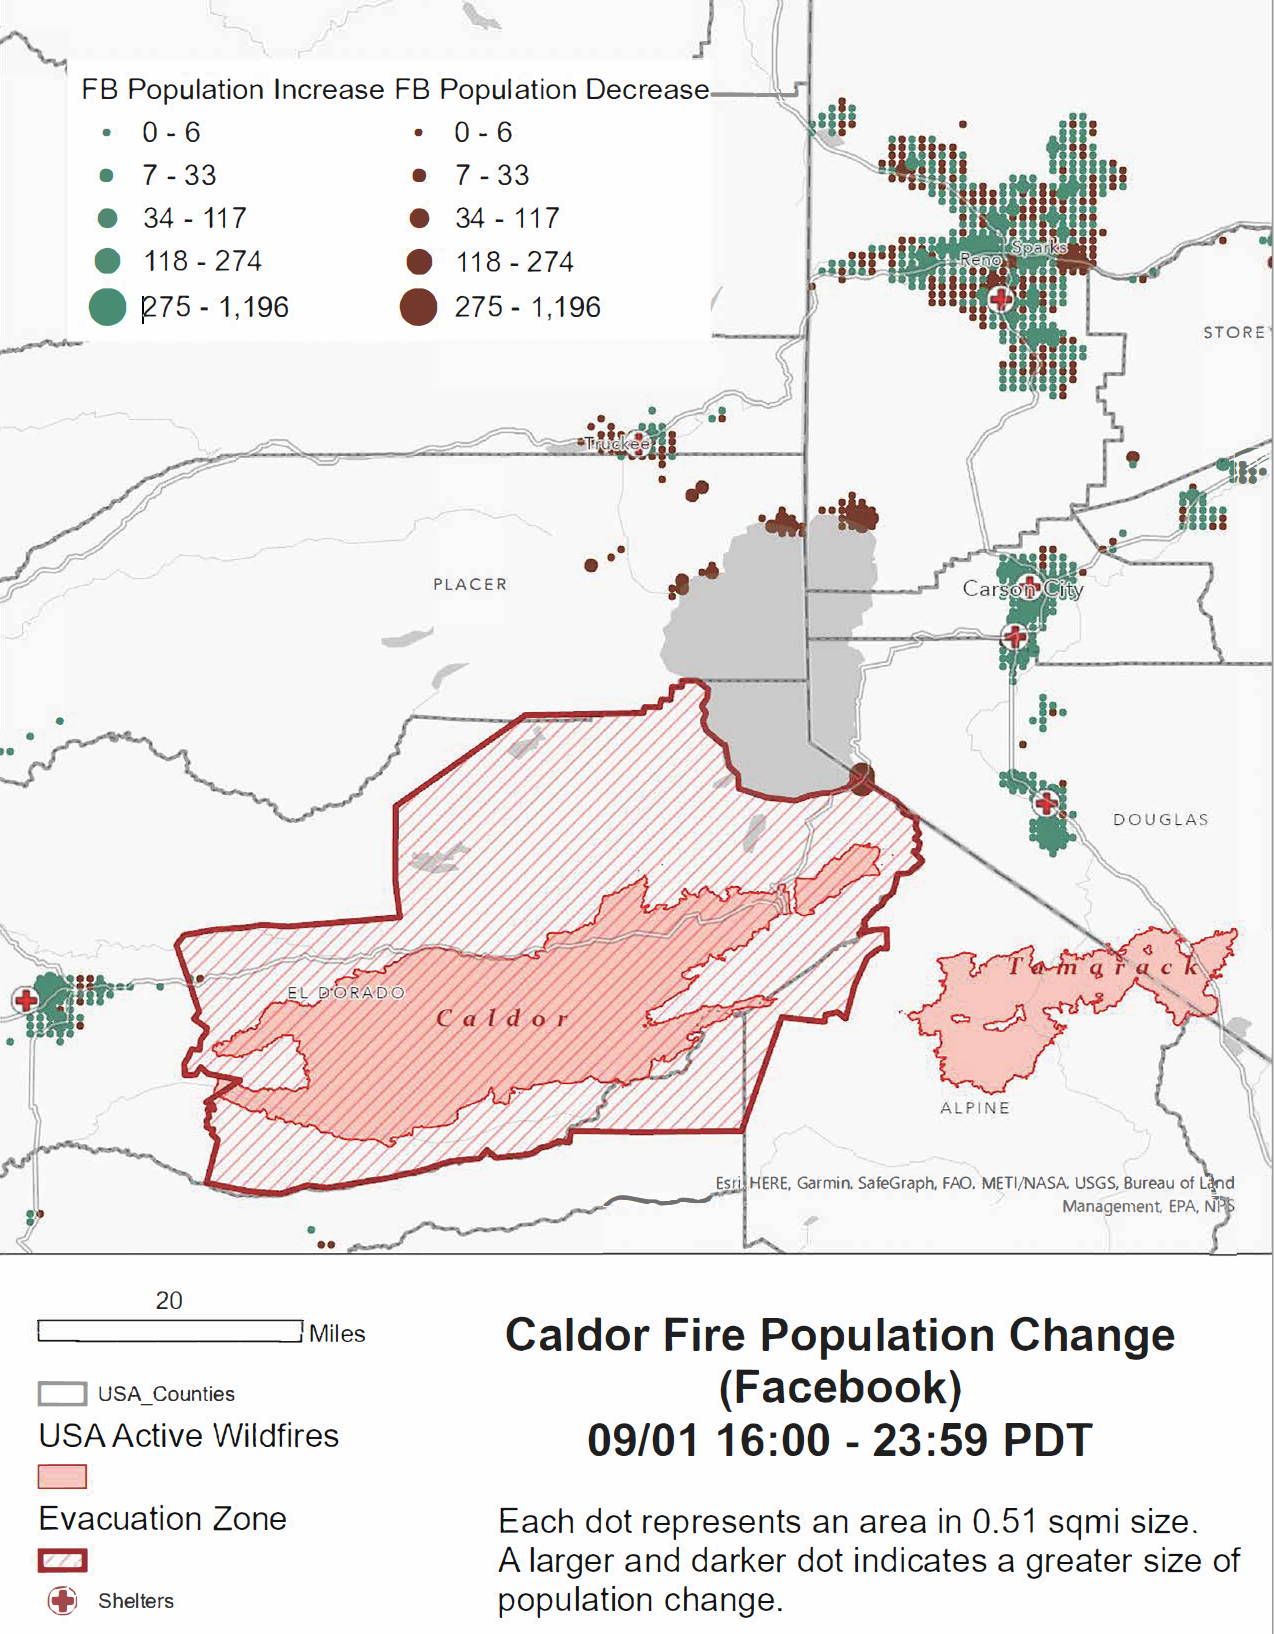
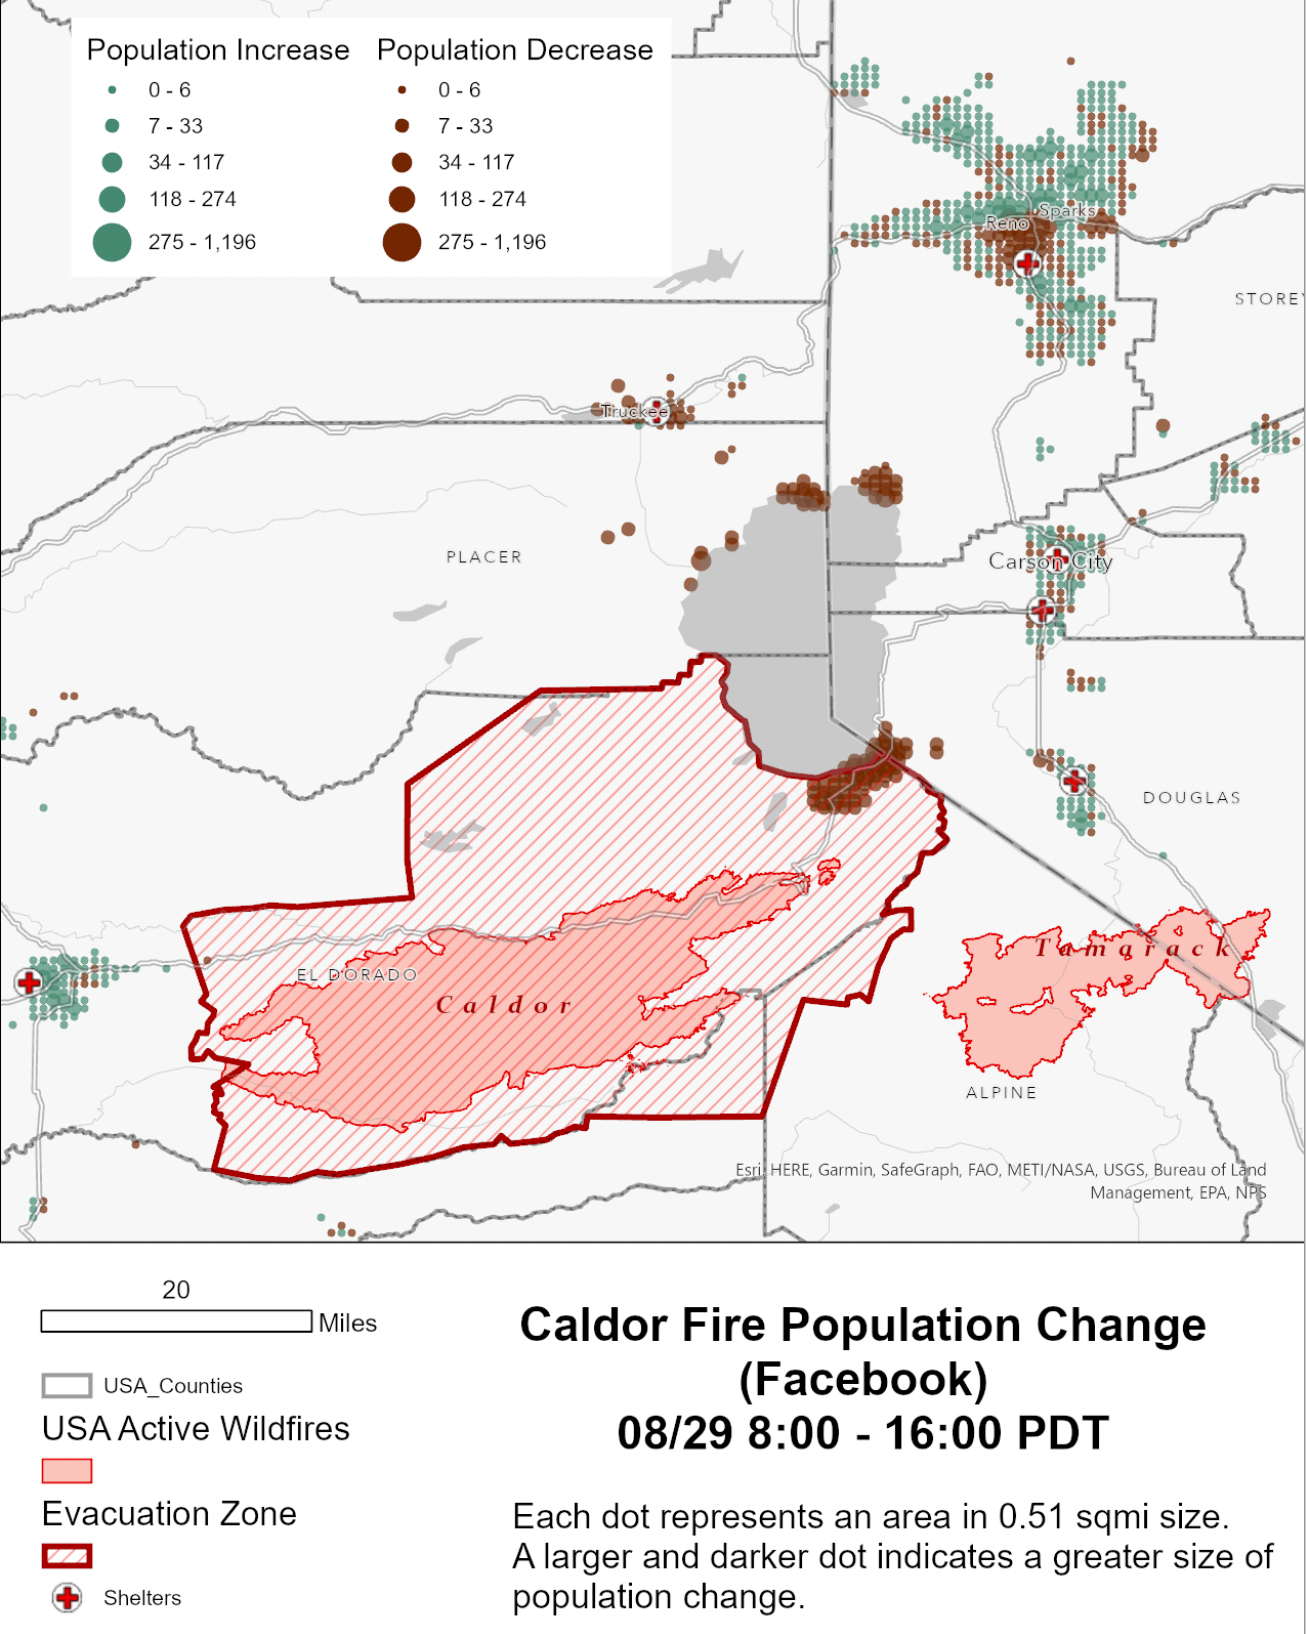
Hurricane Ida in Orleans Parish, Louisiana
Report – Population Density Changes
Date: 7 – 8th September, 2021
Archived Reports
Period: 26 August – 7 September