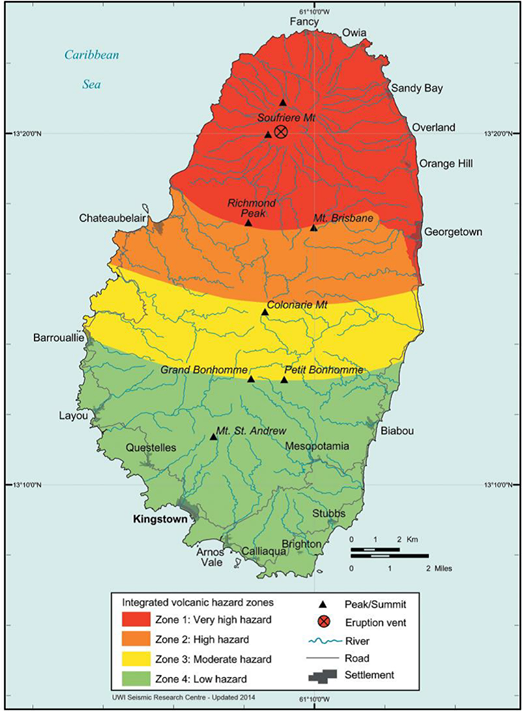
The La Soufriere volcano on the island of St Vincent began erupting on the 27th of December at the end of 2020. On April 13th, 2021 an enormous plume of ash and smoke spewed from the crater. Over 16,000 people (roughly 40% of total population) were evacuated off the island, and many more were displaced from their homes, principally towards the southern portion of St Vincent.
Spatiotemporal analysis of population density data from Facebook Data for Good for St Vincent from the period covering the 9th of April until the 14th of May saw population density decline by roughly 50% for the northern St Vincent communities around Georgetown, Chateaubelair, Bay Village, Point Village and London. All of these areas have been declared as either very high or high hazard zones by the National Emergency Management Organisation (NEMO) of Saint Vincent and the Grenadines. These estimates are in line with official data regarding the proportion of evacuees from this area.
Movement and Population Density Changes
The days following the eruption saw consistent increases in population density around the green zones (low hazard zones). Highest population density increases have been around Barrouallie, Layou, Campden Park and Calliaqua where the density from baseline has risen by more than 43% through the end of April. Other places where density has increased include Mesopotamia, North Union and Port Elizabeth in the Grenadines.
Population density trends were consistent from 9th April till the end of April. However around the 26-28th April, there were slight increases in density around Georgetown which may have indicated a return to home locations. Displacement data available from Facebook suggests that ~2% of the population returned back to their hometowns within that timeframe.
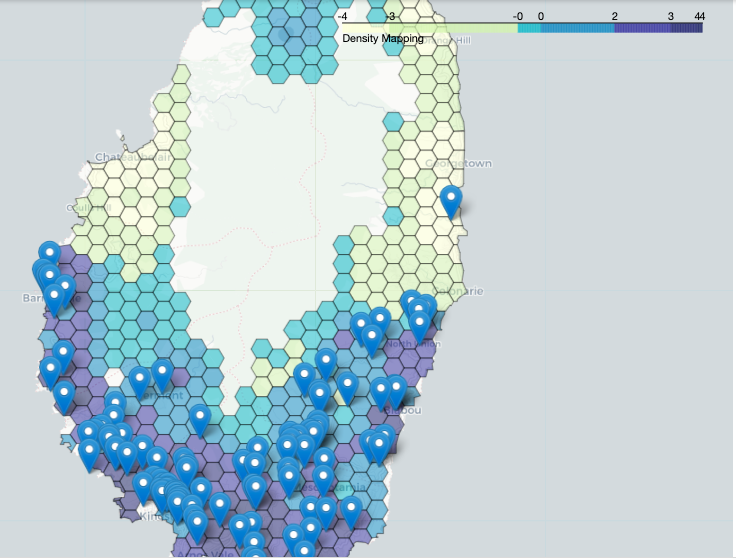
All 107 shelter locations (data made available by NEMO) are situated within the green zones. The results of a Moran’s I bivariate spatial correlation on shelter locations and population density suggests a weak spatial clustering of shelter locations and places where maximum mobility is happening (~0.18 correlation). We see similar results while running a bivariate spatial correlation on health sites and population density (~ 0.19 correlation); with a majority of health sites being clustered primarily around Kingstown and Campden Park.
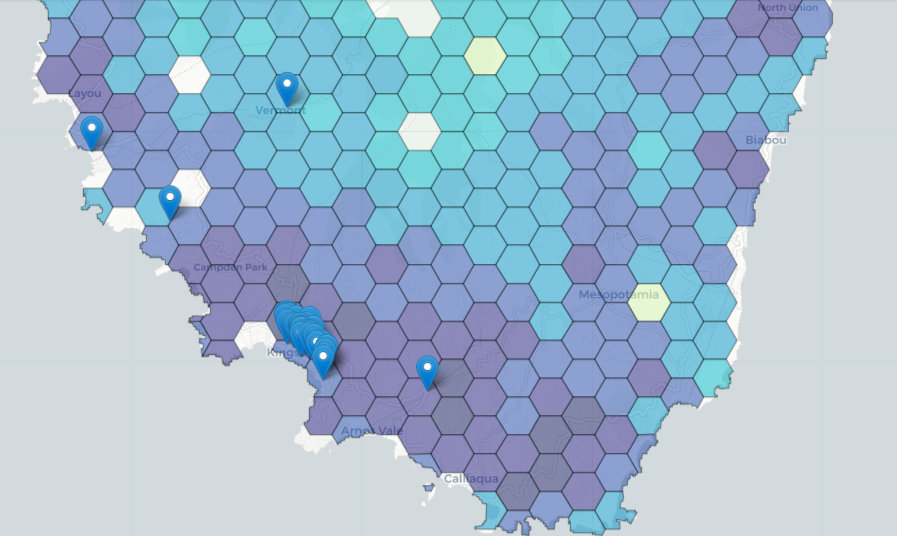
Note: the spatial correlations are being run on hexagons generated for every 1-mile radius of the island using GIS software.
Gender and Displacement
According to Facebook’s gender-disaggregated data on long-term displacement, calculated beginning 10 days after the onset of the crisis, the overall displacement trend to parts of the district of Charlotte was around 63% for women and 36% for men (this could be a result of a temporary displacement to further move to other places in the south). Looking at the displacement trends across administrative boundaries of Saint Vincent, we can see the highest rate of movement happening from Charlotte to Saint George; around 48% of the female population got displaced to Saint George compared to 32% of the male population. This is followed by trends occurring from Saint David to Saint Andrew where around 12% women of the total female population were displaced to the green hazard zones in the south; this corresponds to a 100% displacement of the total overall displaced to Saint Andrew. Amongst the red hazard zones in the north, 32% of the female population and 30% of the male population never left their homes.
Evacuation efforts led by the government in Saint Vincent, along with several disaster response teams, are still underway where people are being moved to the green zones through the second week of May. Direct Relief supported the government of St Vincent and others with shipments of PPE, burn creams and other basic medical supplies.
With hundreds of individuals still in temporary shelters, It remains to be seen how these mobility patterns maintain going forward, and what dynamics to expect when things begin to stabilize long-term across the island.
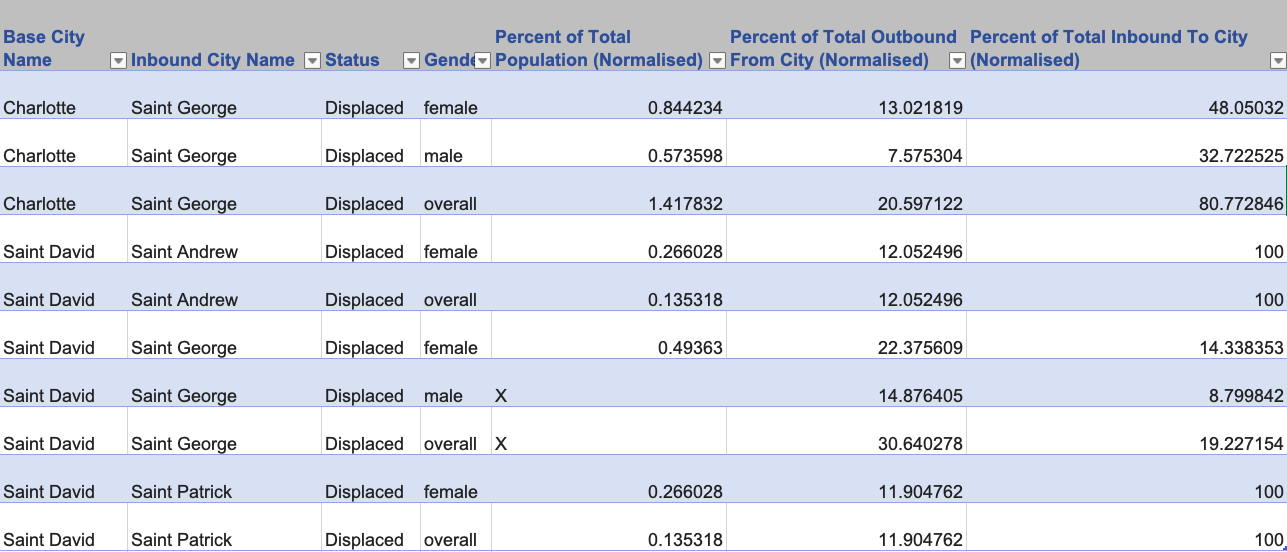
Note: Percent of total population: Percentage of people of the given gender in this category out of the entire total population for the given gender in the city; Percent of total outbound from city normalized to overall: Percentage of people of the given gender displaced away from home city out of everybody who began in home city before the event; Percent of total inbound to city normalized to overall: Percentage of people of the given gender displaced to the current city that are coming from the home city out of the total overall inbound to that city.