Overview
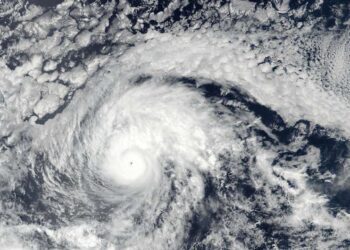
Hurricane Milton, a powerful Category 3 storm, made landfall south of Tampa Bay, Florida, on October 9, 2024. Packing sustained winds of over 120 mph, the hurricane caused extensive damage to homes, infrastructure, and power grids across western Florida. Coastal towns faced storm surges of up to 12 feet, and heavy rainfall triggered widespread flooding. Over 2 million residents were under evacuation orders, with thousands seeking shelter inland.
As the disaster unfolded, CrisisReady produced a series of situation reports to support disaster preparedness and response in the regions most affected by Milton. These reports offered insights into population movement patterns and community vulnerabilities, providing emergency responders with data that could help prioritize aid and allocate resources effectively.
Tracking Population Density Changes During Hurricane Milton
Mass Evacuations and Population Shifts
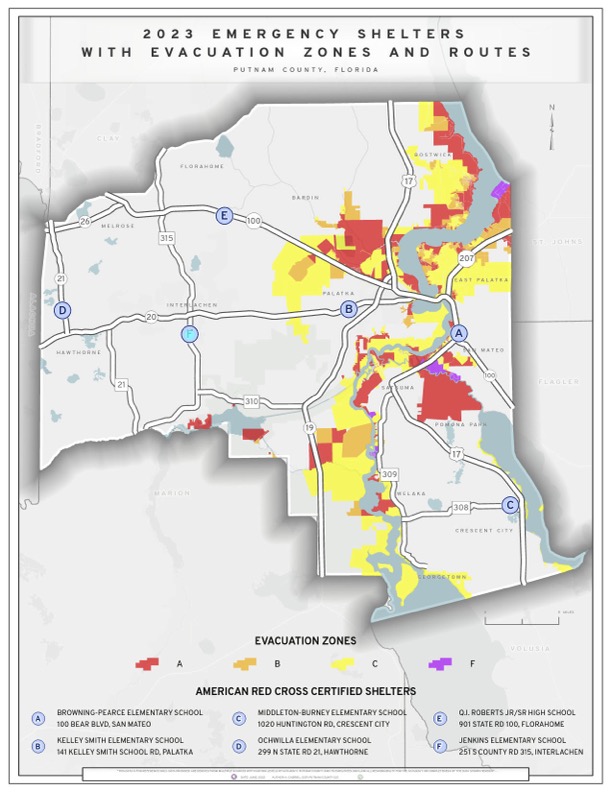
As Hurricane Milton approached and ultimately made landfall on Florida’s Gulf Coast, dramatic shifts in population densities across evacuation zones provided key signals of displacement and movement. A hurricane evacuation zone is a designated area identified to protect public safety during storm surges, the deadliest hurricane hazard. Evacuation orders in Florida are issued by Zone (A, B, C, D), as shown in the color-coded map to the right, to guide residents to safety based on risk levels.
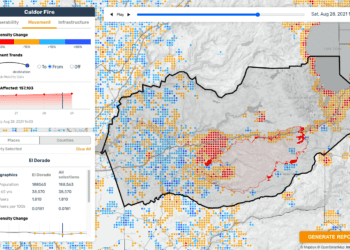
Using real-time data from Meta’s Data for Good program, we analyzed these changes to understand evacuation patterns and their implications for emergency response.
Below is a chronological overview of how population densities evolved as the hurricane unfolded.
October 8, 2024: Early Evacuation Trends
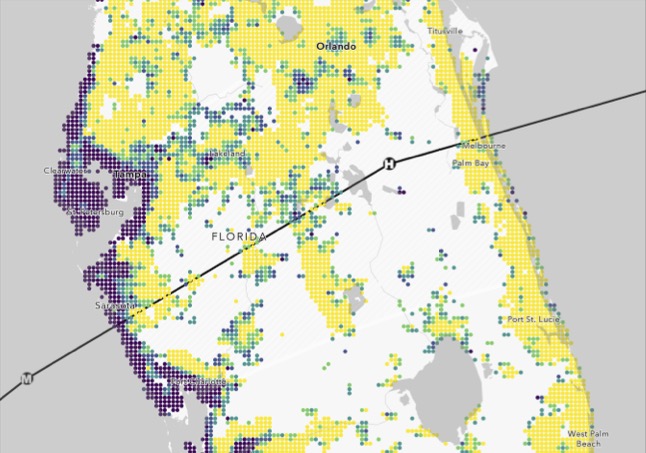
By the evening of Tuesday, October 8, evacuations had begun across mandatory evacuation zones as Hurricane Milton’s forecasted path narrowed.
- The earliest impacts on population densities were observed in Zone A, which experienced a 25% decline below the pre-storm baseline, reflecting high compliance with early evacuation orders.
- Zone B and C: Populations declined at a slower rate, indicating delayed response compared to Zone A.
Key: (z-scores)
Purple: -4.000000 – -1.880460 (lowest decrease)
Blue: -1.880459 – 0.259607
Teal: 0.259608 – 1.560452
Green: 1.560453 – 2.844708
Yellow: 2.844709 – 4.000000 (highest increase)
October 9, 2024: Hurricane Milton Makes Landfall
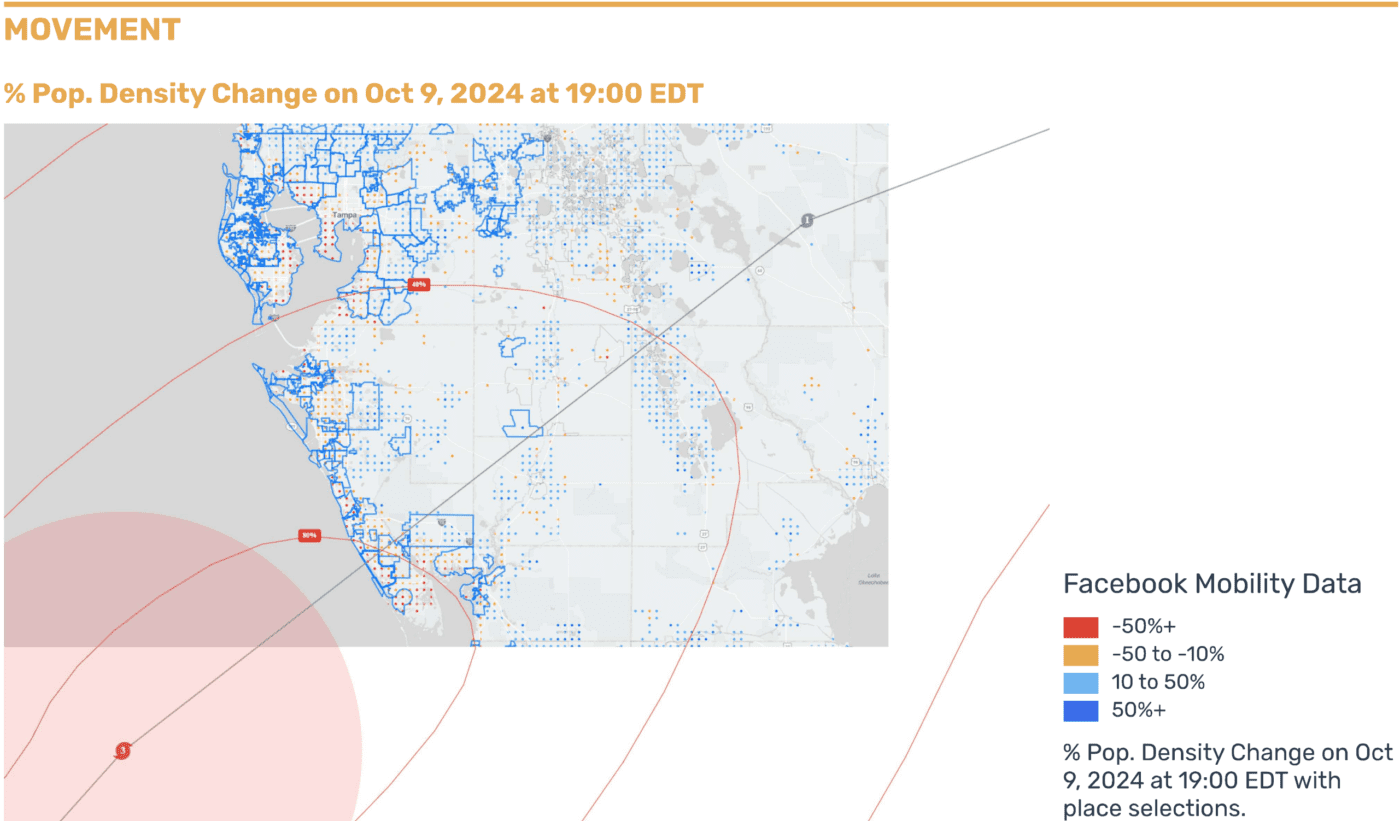
On Wednesday night, October 9, Hurricane Milton made landfall south of Tampa Bay as a Category 3 storm. As the storm approached, evacuations accelerated, with significant reductions in population across affected zones.
- Zone A: Population declined nearly 40% by Wednesday evening.
- Zone B: Population fell by about 10%, indicating fewer mandatory evacuations compared to Zone A.
- Coastal towns experienced particularly high evacuation rates, with population reductions of up to 93% in areas such as:
- St. Pete Beach: -93%
- Treasure Island: -86%
- Siesta Key: -81%
Meanwhile, populations in inland counties began to rise as evacuees sought refuge. Areas like Polk, Hardee, and Pasco saw notable increases in population densities, reinforcing the trend of short-distance displacement rather than long-distance evacuation.
October 10, 2024: Post-Landfall Movements
Following Hurricane Milton’s landfall, population shifts continued into Thursday, October 10. Data showed a clearer picture of how evacuees moved within the region:
- Zone A: By Thursday evening, the population had declined by approximately 45% below pre-storm baseline levels, indicating continued departures from high-risk areas.
- Zone B: Population fell to 25% below baseline, reflecting gradual evacuation compliance.
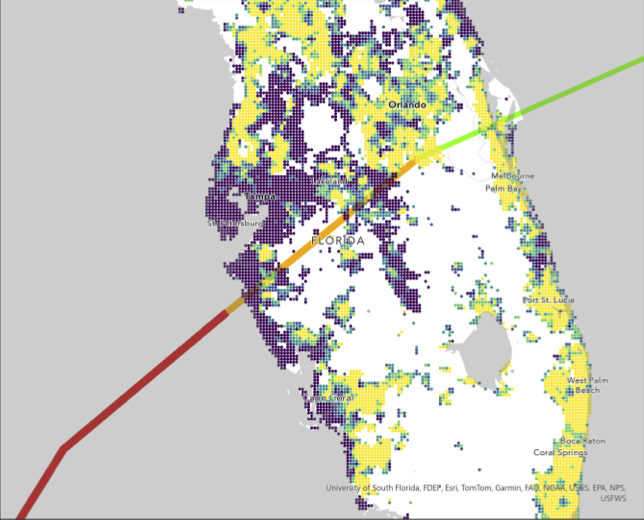
- Zones C, D, and E: Populations increased by 20% to 40% as evacuees relocated inland for safety. These increases highlighted the concentration of displaced residents in inland counties rather than long-distance relocations.
As conditions stabilized, some evacuees began returning to their homes in safer zones, with populations trending back toward baseline levels by late Thursday.
Key: (z-scores)
Purple: -4.000000 – -1.880460 (lowest decrease)
Blue: -1.880459 – 0.259607
Teal: 0.259608 – 1.560452
Green: 1.560453 – 2.844708
Yellow: 2.844709 – 4.000000 (highest increase)
Insights from Population Data
These shifts in population densities underscore the importance of monitoring evacuation trends during disasters. Key takeaways include:
- Evacuation Zone Priority: Areas under the most immediate threat (Zone A) showed the highest evacuation rates, with populations declining as much as 93% in the most vulnerable coastal towns.
- Short-Distance Displacement: Most evacuees sought refuge in nearby inland areas, increasing the population density of counties like Polk and Pasco by up to 40%.
- Data Accuracy and Real-Time Insights: With a representativeness rate of R² = 0.96, Meta’s Data for Good program provided highly reliable data to track movements and inform emergency response efforts.
Understanding population density changes during Hurricane Milton was crucial in identifying evacuation trends, displacement patterns, and community vulnerabilities. These insights not only guided emergency responders in allocating resources but also highlighted the resilience and adaptability of communities during natural disasters.
Header image source: NASA EHDC
